It is important that all traders understand how the futures markets work, so MoneyShow’s Tom Aspray highlights the Herrick Payoff Index (HPI), a well-known indicator that uses price, volume, and open interest.
Even though most stock traders do not trade the futures markets, they should be part of your regular market analysis routine as they can often give you quite valuable insight on what stocks to buy or sell. It is therefore important that all traders understand how the futures markets work and how they can provide unique information.
Option traders should be aware of the open interest when they establish new positions as it gives them an idea of whether an option is liquid or illiquid. Every contract has a buyer and a seller who together make up one contract. For futures traders, the open interest should be monitored along with the price and volume action to determine whether an up or downtrend is strong or weak.
For example, if prices are moving higher and open interest is rising, it is considered bullish as new positions are being created. Conversely, if prices are rising and the open interest is declining, then it is negative as the drop in open interest indicates that short positions are being covered. In this situation, the chances of a rally failure are greater than in the previous example where the open interest was rising along with prices.
If prices are declining and open interest is rising, then it adds more fuel to the downtrend as new sellers are helping to push prices lower. If prices are declining and the open interest is falling, then it is more likely that the price decline is a result of long liquidation rather than new selling.
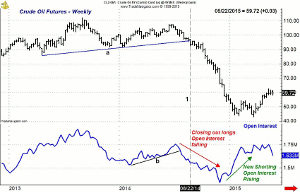
Of course, the last year in the crude oil market has given some stock investors a painful lesson why they can't ignore the futures markets. The weekly chart has the total open interest plotted below the bar chart.
The open interest bottomed with prices in February 2014 and developed a solid uptrend, line b, over the next few months. Prices peaked in June, and the week ending July 4, a weekly low close doji (LCD) was triggered. Two weeks later, the uptrend in the OI was broken as long positions were being liquidated.
Major price support, line a, was broken on a weekly closing basis on August 22, line 1. The open interest continued to plunge as many hedge funds were long crude oil. By the end of November, the open interest had bottomed as crude had dropped 20% in just four weeks. By the start of 2015, the OI was in a clear uptrend as it appeared new short positions were being established.
The OI started to peak as crude oil hit $54 and many analysts were lowering their price forecasts for crude oil from $40 to $20 or even $10 per barrel. As prices dropped to a low of around $44 in March, more short positions were established. The ensuing rally to the $62 area caught many by surprise as some of those who were short crude oil had to cover their positions.
The Herrick Payoff Index (HPI) was developed by John Herrick and is the only well-known indicator that uses price, volume, and open interest. I was fortunate many years ago to witness a very lively debate between John Herrick and James Sibbett, the inventor of the demand index and the debate revolved around whose indicator was the best.
I find the HPI to be an excellent short- and long-term tool and I recommend examining it on both a monthly and weekly basis, but the weekly is the most important. The HPI is simply a mathematical method of measuring the money flowing in or out of a commodity by computing the difference in dollar volume each day.
NEXT PAGE: Identify Intermediate Turning Points
|pagebreak|The HPI can be analyzed on many levels and the most simple is to determine whether it is above or below the zero line. If it is above zero, it shows that money is flowing into the market, therefore positive, while, if it is below zero, it is negative as money is flowing out of the commodity.
I have also found that by using a 21-period weighted moving average (21WMA) of the HPI, one can more easily identify the trend of the HPI. The third level of analysis is to look for weekly divergences that can help one identify intermediate turning points.
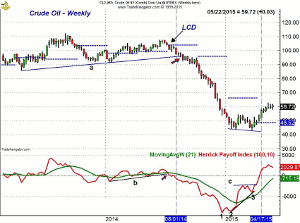
The weekly chart of the HPI on crude oil shows that it moved above the zero line on February 7, 2014, and other than a one-week drop into negative territory, the week of March 21 it stayed above the zero line. The slight uptrend in the HPI was broken one week after the LCD was triggered in July. Four weeks later, on August 1, the HPI dropped below the zero line. By the end of the month, the WMA was below the zero line for the first time since early March.
For the next three months, the HPI was weaker than prices as it made its low on December 19 (point 1). Over the next six weeks, crude dropped another $10 per barrel but on the January 30 low, the HPI was slightly higher (point 2), forming a bullish divergence. One week after the low, the HPI also moved back above its WMA.
When crude made a lower low the week of March 20, the HPI formed a second bullish divergence at point 3. The following week, the uptrend in the HPI was confirmed as the resistance at line c, was overcome. On April 17, the HPI moved back above the zero line indicating that money flow was now positive. The WMA is rising sharply and could cross above the zero line in the coming weeks.
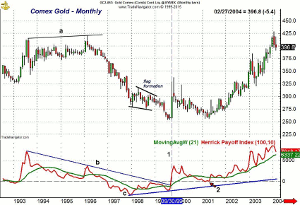
The HPI has historically been quite useful in the metals, especially gold. It did a good job of alerting traders to the 1980 top in gold. In April 1993, the monthly HPI moved above the zero line and then—between 1993 and 1996—it formed lower highs, line b. This was in contrast to the higher highs in price, line a. This divergence was consistent with lower prices as gold declined from above $400 to $255.
In January 1998, gold stabilized and the HPI hit its low. For the next 15 months it traced out a flag formation as the HPI moved above its WMA but stayed below the zero line. Gold pushed to new lows in July and August of 1999 and the HPI formed a bullish divergence, line c. At the end of September 1999, the HPI moved back above the zero line, indicating positive money flow (line 1).
After a sharp two month rally that took gold up to the $337 level, gold again began to drift lower. In early 2001, the HPI dropped below the zero line for two consecutive months (point 2) before turning higher. This was the start of the gold bull market as the money flow stayed positive until April of 2013 when the bullish divergence support (line c) was violated.
NEXT PAGE: Classic Example of a Failing Rally
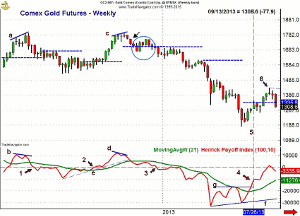
|pagebreak|When analyzing the weekly HPI on gold, you will often see short-term divergences that can give you advance warning of a significant price move. In early 2012, gold made higher highs, line a, that were accompanied by lower highs in the HPI (line b). Two weeks after the high, the money flow turned negative as the HPI dropped below the zero line, point 1. Over the next nine weeks, gold dropped $135 an ounce.
Over the next eleven weeks, gold stabilized and the HPI moved back above the zero line in August 2012, point 2. After a $170 rally, gold again made higher highs, line c, but the HPI diverged as it formed lower highs (line d). A LCD sell signal was also triggered one week after the highs. Three weeks after gold made its high, the HPI dropped below its WMA.
After the initial wave of selling, gold prices rebounded (see circle) but the HPI just rallied back to its WMA, which is a classic example of a failing rally. In early 2013, the HPI also rebounded back to the zero line and the declining WMA before the selling picked up. Gold closed at $1666 when the HPI rebounded to its WMA and the zero line. In June, it had dropped down to the $1180 level.
The HPI actually bottomed in April, and then, at the final low in late June, the HPI formed a bullish divergence, line f. The divergence was confirmed on July 26 (line 5) when the HPI moved above the resistance at line g. Though the divergence was strong, the rally only lasted five weeks as the HPI closed above the zero line for one week and formed a doji (point 6). A LCD sell signal was triggered the next week.
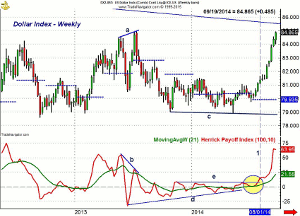
The more liquid the futures contract, the better the signals, but the HPI also did a good job at identifying the bottom in the dollar index in 2014. Prior to the final bottom for this cycle, the dollar had a sharp rally in early 2013 as the HPI moved above the zero line in February as stocks were taking off. The HPI made its high in March, and when the dollar made a new high in May, the HPI was slightly lower. At the final high (line a), the divergence with the HPI was much more severe, line b. The HPI dropped below zero two weeks after the high.
From September 2013 through April 2014, the HPI moved above and below the zero level several times. It continued to form higher lows (line d) even when the dollar index dropped to a new low in May 2014. The HPI rallied back to resistance, line e, in June, but on the pullback, held above the zero line and its WMA (see circle). The ability of the HPI to overcome this resistance on August 1, 2014 (line 1) confirmed that a bottom was in place.
The bullish divergence support in the HPI was not broken until May 1, 2015, but the HPI has stayed well above its WMA since August 2013 as the dollar index has had quite a run. Of course, the strength of the dollar and weakness in the euro was a good reason for stock traders to buy stocks in the EuroZone.
The strong dollar also put pressure on the commodity markets, including gold and crude oil. The HPI for the dollar index will turn higher this week and it has yet to form any serious divergences. I will post an updated chart of the dollar index Friday on both Twitter and StockTwits.
In this article, I have avoided discussing the daily HPI since its signals need to be closely correlated with the weekly analysis, which requires more rigorous analysis.
In over 160 trading lessons, I have always advocated that traders and investors put some time aside each weekend to do their market analysis and review their portfolios. I think the weekly and monthly analysis of the key futures markets—using the HPI—should be part of your analytical routine.

