Candles can tell a story, and sometimes that story can lead to profits. As most traders know, a candle is comprised of the body (the rectangle part) showing the range between the open and close prices and the shadows (sometimes new traders call these the "wicks" coming out of the top and bottom of the body.)
However, not all candles are created equal. Some are important signals that the trend is going to end or that the market is going to take off in a continuation, while others offer limited meaning or no meaning at all. Knowing what these candles and candle patterns look like is half the battle, but knowing the likelihood for a successful prediction is just as important.
This is another in a series of articles to start a discussion around candlestick probabilities. Like everything in the market, the probability of a prediction based on a candlestick or candlestick pattern being correct can be somewhat subjective, but I think this will be informative enough to give any trader a starting place to begin understanding how they can use this information in their own trading. The methodologies I am using here are not the only way to evaluate these signals, but I tried to stick with standard definitions and methods that have proven successful in the past.
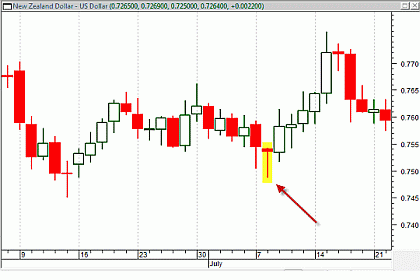
The candlestick pattern I will be evaluating in this article is a "hammer" (as shown in the chart below.) These are bullish reversal or continuation signals. When they follow a downtrend or a downside correction within a larger uptrend, it is wise to pay attention. The candle has a small body with a very small or non-existent upper shadow. The bottom shadow is more than twice the length of the body itself. The story being told here is that bears were driving the market down, and at some point mid-session, the bulls were able to push the market all the way back up towards the day's open. That is a bullish signal and can immediately precede a move to the upside.
NZD/USD Daily Chart
Just how likely is it that this prediction will be correct or that it can be leveraged profitably? I tested the pattern mechanically and found some interesting things. My definition of the hammer is described above, and in the test I assumed that a trader would immediately go long on the next candle with a trailing stop. Whether that trade was profitable or not defined whether the pattern was successful. Here is a summary of my findings:
Pairs tested in order of effectiveness:
USD/CHF
GBP/USD
USD/CAD
EUR/USD
NZD/USD
AUD/USD
Testing Period
Daily Candles 01/01/2000 - 08/05/2008
Percentage of Winners (profitable trades)
48%
Ratio of Average Gain:Average Loss
2.3:1
Expectancy
+58.4%
Summary
The signal seems to be useful not only as a trigger for long positions, but also as a risk indicator for uncovered short positions. This is useful because a trader can tighten their risk coverage in the middle of a short position in case the market does reverse. If the pattern fails, that coverage can be lifted to keep profits open. Depending on your investing profile, both long-term and short-term traders can take advantage of a signal like this to manage and time their positions.
By John Jagerson, of PFXGlobal.com and LearningMarkets.com.


