Brandon Wendell of Online Trading Academy explains why most traders use a popular indicator incorrectly, and gives several examples of how to use it the right way.
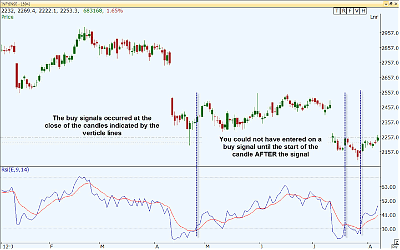
When traders use oscillators for trading decisions, they often use them incorrectly. Most will wait for a buy signal from an oversold oscillator crossing the line marking oversold or they will wait for a sell signal from an overbought indicator crossing below the line.
The problem with both of these signals is that they are lagging, and will always signal you to enter or exit after a change in price.
In the Extended Learning Track (XLT), we teach traders to time their entries and exits based on supply and demand levels. These levels mark the areas where prices are most likely to reverse based on the simple economic laws of supply and demand.
This, coupled with the fact that price action is dictated by the emotions and beliefs of the people trading them, allows us to identify turning points prior to price actually reacting. People often repeat actions that brought them pleasure and avoid those which caused pain. Supply and demand therefore becomes a leading indicator.
Knowing the delayed nature of oscillators, we can still use them with some adaptation to increase our confidence in taking trades at supply and demand levels. The key is in using them in a different manner.
Many of you who have followed my writings or have been in my classes know that I like to trade technical patterns that I see on the chart. What you may not realize is that those same patterns can often be found on the oscillators as well.
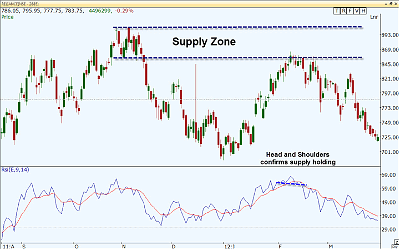
Looking at the following chart, you can see the price of Reliance approaching supply on the daily chart. At the same time, there is a head and shoulders pattern observed on the Relative Strength Index below. This is a signal that warns of a reversal in momentum.
Ending upward momentum at a supply level will usually signal a bounce and a shorting opportunity. At the very least, a trader would be wise to exit their long positions.
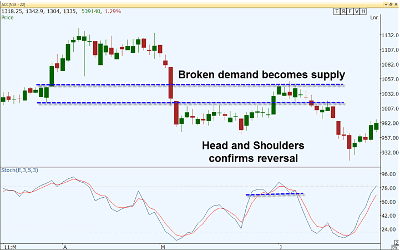
This same technique can be used on any time frame with any oscillator. In the next example, I used the daily chart with a stochastic oscillator set to five periods. Price broke through as demand zone switched its role to a supply. As price reached supply again, the reversal was confirmed by a head and shoulders pattern on the stochastic oscillator.
Another interesting use of the oscillator is to confirm trend reversals with a trend line. Remember, you only need two points to draw a line, but a trend line isn’t confirmed without three points of contact.
An oscillator trend break signals a lack of momentum in the current direction. Break an uptrend in the CCI and you will usually see price falling away from supply. The same occurs when a rally in price is preceded by a break of a downtrend in the oscillator. The CCI or RSI oscillators work best for this technique, but stochastics can be used as well.
So do not depend on the oscillators for buy or sell signals—you will be late. Instead, use them as confirming indicators when prices reach supply or demand zones.
Brandon Wendell is a trading instructor with Online Trading Academy


