With the US stock market extending its winning streak, a key element missing is corresponding strength in copper, which has historically been viewed as a barometer of future growth, but the staff at FuturesTechs.co.uk, believes it might have finally reached a turning point.
We write analysis on a daily basis for over 30 different markets each day. Sometimes a chart comes along that smacks us in the face and says “buy” or “sell.” This doesn’t mean there’s a trade to do, as the risk/reward has to be right, as well as the market conditions.
Wednesday morning we’ve had one such moment, when looking at the copper chart.
Below is that morning report:
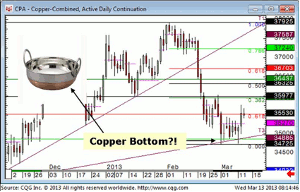
We have now seen a move away from trend support, suggesting that this line was a bridge too far for the bears.
The move higher didn’t come as a massive surprise thanks to the hammer we highlighted on the daily chart this time Tuesday.
We also have a “double bottom” buy signal with the move through 354.45 and now we’d ask that this level, and/or Marabuzo support at 353.70, do a job as support to add weight to the idea that we’ve bottomed out.
We won’t have to wait too long to find out!
The next task for the bulls is to take out bold resistance around 360.
We had highlighted the hammer candlestick in Tuesday’s report. A hammer is a candle with a long lower shadow and a small real body at the top of the day’s range, the result of a downside rejection-type move. We watch out for these then ask for a confirming move, which is what’s been seen here. These are especially important if seen at key technical levels like the uptrend line on the longer term copper charts right now.
Below are the charts:
Daily Chart showing hammer candle on trend support, which just appears at the bottom right hand side of the chart.
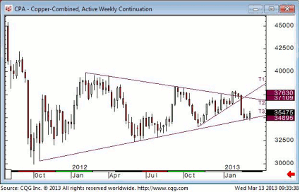
Weekly continuation chart showing this trendline from its starting point. This chart suggests upside might be limited to the downtrend line which sits at 371 at present.
So what’s the trade?
BUY (May ’13) Copper at 355,
Stop at 345,
Target 1 is 370
Target 2 is 379
This offers good enough reward/risk although it’s not totally ideal. We would like to see support levels around 353-55 holding today, and then we’ll be comfortable moving the stop up to near entry.
Risks to the trade: We’ve entered too early and need to wait a bit longer to see if 353-55 is indeed a strong support zone.
By the Staff of FuturesTechs.co.uk


