

I generally avoid trading gold. It is a useful indicator of possible changes to stock market trends but it’s full of passionate (read crazy) traders and investors that some people call gold bugs, writes Greg Harmon of Dragonfly Capital.
Gold bugs appear to be an omnipotent bunch. They can look at anything that is happening anywhere in the world and relate it to why it is a positive for future gold prices. Talk to one long enough and it will seem like the price of gold will always go higher and that you are crazy if you do not have at least one gold bar in your house.
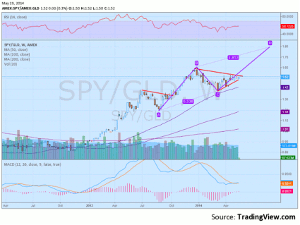
I have written about the potential for gold prices to fall and do see the long-term trend as lower but with a potential morph into a consolidation range. But every time I focus there, I find a bunch of new gold bugs who quickly set me straight. So today I am taking a slightly less controversial stand. Stocks as measured in gold, look like they are ready to break higher. The chart below shows that since the beginning of 2013 the ratio of the S&P 500 (SPY) to gold (GLD) has steadily moved higher.
Click to Enlarge
There was a set back in the summer of 2013 and then it continued. And there is a set back that is starting to correct now. The ratio is starting to move above the trend resistance and the RSI is slowly moving higher while the MACD has crossed up. These support a continued rise in the ratio.
How far can it go? Overlaying a standard AB=CD pattern suggests a target of 1.80 or 18% above the current level. Now, before you get all gold bug crazy on me about gold predicting gold prices moving lower, the ratio can go up with gold also rising, but more slowly, or with gold holding in place.
By Greg Harmon of Dragonfly Capital


