Even though oil’s crash has been all over the news as of late and its impact has been felt by stocks, the staff at BespokeInvest.com points out that, for the most part, it has been a slow, steady drop.
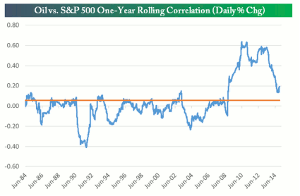
Oil's (USO) crash over the last few months has dominated the headlines, and over the last couple of weeks, its impact has been felt on stocks as well. If you're wondering, below is a chart showing the correlation between the daily movements in oil and stocks. The chart shows the rolling one-year correlation between the daily percentage changes of oil and the S&P 500 (SPX) (SPY). A correlation of 1 would mean the two have moved hand in hand with each other over the past year, while a correlation of -1 would mean the two have mirrored each other over the past year.
As shown in the chart, up until 2009, there was not much correlation (positive or negative) between the two, but the financial crisis caused their correlation to increase dramatically (both fell sharply along with most other asset classes). Throughout most of the current bull market coming out of the financial crisis, though, the correlation remained relatively elevated as well. Over the last two years, you can see that the correlation has dropped dramatically, but it's still slightly above the range it had been in for decades prior to 2009. Not until just recently when oil's drop began to really get noticed did the correlation stabilize and tick slightly higher.

Courtesy of bespokeinvest.com
Click to
Enlarge
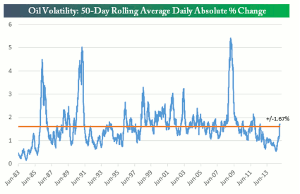
While oil has dominated the headlines recently, its volatility hasn't spiked dramatically. For the most part, it has been a slow, steady drop. Below is a chart showing the rolling 50-day average +/- daily percentage change for oil going back to 1983. As shown, over the last 50 trading days, oil has seen an average daily change of +/-1.67%. This is only 7 basis points above the average daily move of +/-1.60% seen for oil over the last 30 years. If anything, the takeaway from the chart is that oil's volatility had gotten extremely low coming into the current bear market and it's just now getting back to normal levels.

Courtesy of bespokeinvest.com
Click to
Enlarge
By the Staff of BespokeInvest.com


