While some analysts might say that this is just a correction, when it comes to putting dollars at risk, Blake Robben, of Archer Financial Services, prefers the technical method; here, he takes to the daily and monthly charts on the S&P E-mini Futures and highlights key levels to watch.
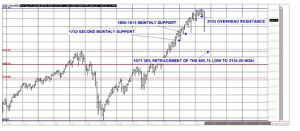
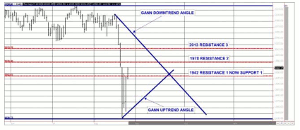
When the stock market starts to make evening headline news, prepare yourself for extreme volatility. The market cheerleaders will say everything is OK, this is just a correction. When it comes to putting dollars at risk, I prefer the technical method. Let us look at the daily and the monthly charts:
Daily September E-mini S&P Futures
Big Picture S&P Futures

Charts provided by QST
Click
to Enlarge
Bottom Line Analysis
Major overhead resistance zones come in at 2013 to 2035. Any close above 2035 would suggest the grizzly bear has turned into a cubby bear and look for a bull stampede to retest the highs. Conversely, any close below 1941 would suggest a retest of swing lows of 1905. So you have your numbers based on solid technical analysis, not a market carnival barker that gets paid to be long.
By Blake Robben of Archer Financial Services


