
Practical application of Fibonacci analysis can help to identify proper entry points and pinpoint profit targets and stop levels, says John Jagerson of LearningMarkets.com.
In this article, I will discuss how to use a Fibonacci retracement to time trade entries and control risk. This is done through identifying profit targets and initial stops or hedges. In an upcoming article, I will go into more detail about how to move those profit targets and stops as the trade progresses.
As with most analytical tools, there are many great ways to accomplish the same task. Analysis will vary due to individual risk tolerance, personal preference, and experience. While I have included some specific ideas in this article, there is no satisfactory substitute for your own experience. Take the concepts I have shared here and practice using and adjusting them in the live market.
Timing Entries
Fibonacci retracements are very productive
for timing entries in the direction of the trend. However, defining the trend is
where many trip up in their analysis. This can be simplified considerably
by defining the trend simply as the price area to which you applied the
Fibonacci retracement.
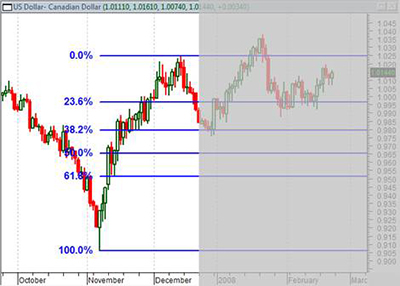
Let's look more closely at an example from the past. In the chart below, you can see the Fibonacci retracement level attached to the rally from November to December of 2011 on the USD/CAD. Let's assume for a moment we're back in December of that year and we're looking at the chart at that time (the non-shaded area).
USD/CAD Daily Chart
Click to Enlarge
We have a clear trend in that time frame, so it's time to start looking for potential support levels. The retracement study has drawn four horizontal lines that correspond with each of the major Fibonacci levels I will be using.
Each of these lines is a potential candidate for support and an entry position for a long trade. But which one should we pay attention to? The answer is: We wait. The Fibonacci level does not become important until price reacts to it. Once that happens, we can take some action.
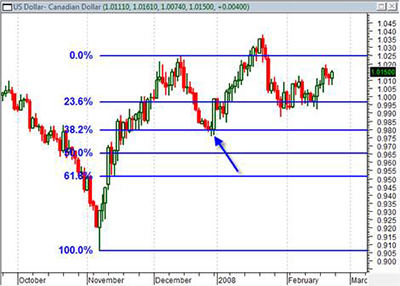
In the chart below, you can see that prices bounced neatly off the 38.2% retracement level. If we're pretending again that we're looking at this back in December, we'd determine that this looks like a great entry opportunity.
Well, we can see what happened next in the chart below. We bounced off that support level, and after a short downside move after the first of the year, we got the long-term move we anticipated-all the way up to the peak.
I want to make a quick note on the downside move, and mention trading emotions. Many, many traders let their emotions get in the way of their analysis, and they panic when they see a downside move against their trade. If we had panicked at the first of the year on this trade, we may have missed the long upside move we had predicted in our analysis. You should give your trades room to move. The market is volatile and rarely moves in just one direction. Before you exit a position early, make sure you have a good reason to do so.
NEXT PAGE: Be Educated and Prepared
|pagebreak|Be Educated and Prepared
This historical example is
great, but we're looking at it in hindsight. When you are in the live market,
even with proper analysis, you can't always predict what is going to happen. To
really complete your analysis and be prepared for the unknown, ask yourself
these three questions:
- What constitutes a bounce?
- What is the initial profit target?
- Risk control: Where should a stop be set?
USD/CAD Daily Chart
Click to Enlarge
Is It Really a Bounce?
Traders will often use some sort
of percentage movement to trigger a trade based on a support bounce. I set my
entry order at the midpoint between the Fibonacci level acting as support and
the next Fibonacci level above it. In this case, with the 38.2% line at .9800
and the 23.6% line at .9960, the entry order should be set halfway between the
two, or at .9880. This can be adjusted depending on your own tolerance for risk,
but that is a pretty good rule of thumb.
Finding the Initial Profit Target
Since this analysis is
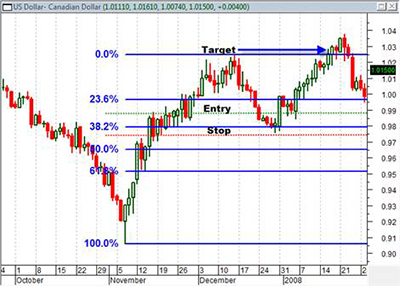
designed to conform to the previous trend, I would target the top of the
Fibonacci retracement at the 0% line, or 1.0250. If prices break this level, you
will need to reevaluate where you think the market will go. In the next section
in this series, we will talk about developing profit targets beyond the bounds
of the Fibonacci retracement. However, as an initial profit target, the 0% line
or top of the retracement is where we would expect to have seen the top of our
trade, based on the previous trend.
Proper Risk Control
Risk control
is extremely variable and depends on what your risk tolerance is. However,
placing a stop about one-third of the distance between two lower Fibonacci
levels is a reasonable rule of thumb. In this case, if the 38.2% level is at
.9800 and the 50% level is at .9650, the stop will be at .9750, or 33% under the
support level. Most traders use stop losses to control that risk, and that is
recommended for new traders. But more experienced traders could consider a call
option in this same scenario. A call option limits the risk, but leaves the
trade open, avoiding "whipsaws" where the uptrend is preceded first by a quick
downtrend below your stop level.
Bringing It All Together
So let's tie this all back
together. In the image below, I've drawn in the entry, target, and stop levels
on the graph, based on the directions above. Pretending we're back in December,
not knowing what would happen, we could complete our analysis and know where to
get in, where to set our stop to limit our risk, and what we could expect our
potential profits to be.
USD/CAD Daily Chart
Click to Enlarge
"X" Factors
One thing you can be sure of is that most
technical systems, if applied too rigidly, will be unprofitable in the long
term. There are just too many other issues involved. However, being aware of
these "x" factors can help you prepare and become more productive.
- Fundamentals
Trading a currency pair in the direction of the overall fundamental balance in a great idea. It helps support the trend and can increase your chances of success. In past lessons, we've talked about fundamental factors you should consider as you compare two currencies. Be aware of the fundamental balance and changes as your trade progresses. A major shift in fundamentals can turn your technical analysis on its head quickly. - News Releases and Market
Developments
Imagine knowing what news was going to be released in advance? How much would that help your trading? Would you ignore that information because "All you really need are technicals?" Of course not, and yet, that is what many traders do all the time. As news is released or changes take place in the market, you should reevaluate your trades. For example, the CAD is very sensitive to oil prices. Should I remain long if oil prices begin breaking out to the upside? Should I leave the trade alone and not use that information? Of course not; I should consider the live market and new information as one of the most important tools I have access to. - Channels
One question traders always ask is how long you should stick with your analysis when the trade channels around its entry price without hitting either your exit point or profit target. I think most traders should reconsider their analysis once the channel has lasted the same length of time that the previous trend lasted. In the example above, the trend started on Nov. 7 and lasted through Dec. 14 before the retracement. That means that if the trade had not made some meaningful movement before Jan. 17, you should probably abandon it and look for something else.
By John Jagerson of LearningMarkets.com


