
Walker England of DailyFX.com shows how to trade this classic chart pattern.
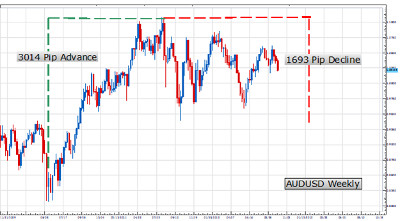
The AUDUSD is generally known for its long trending moves. However, the pair has been quietly consolidating after its 3014 pip advance from the October 2008 low at .8065, to the July 2010 high at 1.1079. Since this point, the pair has stalled moving sideways and can be seen consolidating on the chart below. One way we can take advantage of consolidating market is to look for opportunities using pricing patterns using support and resistance levels. Today we will learn about trading the developing triangle on the AUDUSD.
Click
to Enlarge
(Created using FXCM’s Marketscope 2.0 charts)
Looking closer at the AUDUSD Weekly graph we can see the creation of a symmetrical triangle pattern. To identify this pricing pattern, we first need to identify the graphs current support and resistance points by connecting the charts previous highs and lows. Resistance for the pair can be drawn by connecting the July 2011 high with the highs put in place in February and September of 2011.The ascending support line has been drawn by connecting the October 2011 and May 2012 lows. With prices trading between these two converging points, traders have several opportunities to place entry orders.
NEXT PAGE: Two methods of trading triangles
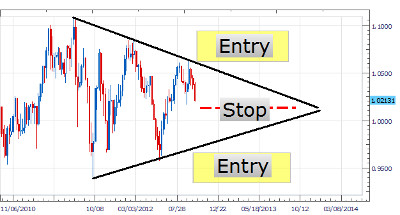
|pagebreak|The first method of trading a triangle, depicted below, is to wait for the AUDUSD to breakout from current support and resistance levels. This is the most passive way to trade triangles, as traders don’t have to have a clear market direction and can setup both buy and sell entries. Traders can plan to sell a break of support and trade the pair to new lows under .9750. At the same time a buy can be used above resistance, to prepare for a breakout to a new high above 1.0500. Stop orders can be placed on both entries in the center of the triangle pattern, to limit risk exposure in the event of a false breakout.
Click
to Enlarge
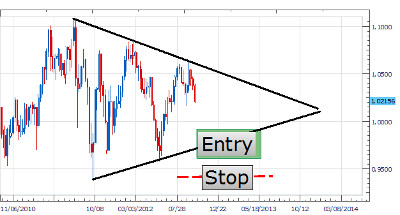
The second method of trading a triangle is to consider buying and selling between established support and resistance levels. In our AUDUSD example pictured below, we can see price selling off after testing our standing line of resistance. Traders may consider selling the AUDUSD at this point, as it continues moving towards support. Orders to buy can also be used and at support. Traders using this option will look to continue to trade these levels as long as the triangle is maintained. A stop order should be considered outside of support and resistance preparing for the pairs eventual breakout.
Click
to Enlarge
(Created using FXCM’s Marketscope 2.0 charts)
Regardless of your opinion of the market, understanding triangle patterns can assist us in our trading decisions by establishing a trading plan for consolidating markets. Remember, identifying support and resistance is the key. Once these levels are found we are free to implement the strategy of our choosing by setting our entries, stops, and limit orders appropriately.
Walker England is a trading instructor at DailyFX.com.


