These two patterns are mirror images of each other and provide important clues on whether momentum is about to swing in the other direction, writes Christopher Lewis of DailyForex.com and TheTraderGuy.com.
One of the most important candlestick formations that a trader can learn is without a doubt the “hammer” or “shooting star.” In a nutshell, these candles can show a potential reversal of the trend. They tend to congregate at important inflection points in the markets, and can often predict a sudden move in the other direction.
One of the main reasons they work is that so many people are familiar with them. It is probably the first candlestick a lot of traders learn. While they have different names, they are essentially the same thing: A representation that exhaustion is setting in for the market and it could reverse course soon.
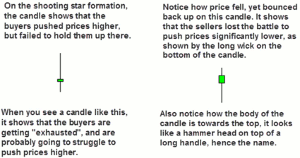
The names are used depending on what direction the market is heading. When the market has been rising, the formation is called a shooting star. When the market has been falling, it is called a hammer, mainly because of the fact that it looks like one. When you see one of these candles, it might be time to get ready to head in the other direction soon. Having said that, let’s take a look at these formations:
As you can see from the “shooting star,” a long wick has formed above a fairly neutral finish. Neither the buyers nor the sellers took control during this candle. However, one important clue has been left behind: the long wick on top. This shows that although the buyers did manage to push prices higher, they failed to hold them up there. This shows what is known as “exhaustion” in the markets, and signifies that buyers are probably going to struggle to continue to move prices higher.
On the “hammer” candle pictured above, you can see very similar facts, except in opposite terms. The sellers did manage to push prices lower, but didn’t hold the market down there. That shows that they may be running out of conviction, and might struggle to take the market lower in the future as well.
The important thing about these candles is that they be positioned at a swing high, in the case of the shooting star, or a swing low, in the case of the hammer. By being at a recent high or low, it shows that the momentum is slowing. This signals a possible change in direction as strength is waning in the recent movement. For example, if price has been climbing for weeks in the market you are trading and a shooting star appears one day, this could be a sign that the strength of the move is failing. (They all do eventually.)
The length of the wick is important as well. It shows just how far the buyers, in the case of the shooting star, actually managed to push prices—only to fail. So not only does it show the attempt, but it also shows exactly how hard the sellers pushed back! (Vice versa for the hammer.) This is an important clue as is shows that the momentum is swinging in the other direction. In fact, the longer the wick, the better.
By Christopher Lewis, Contributor, DailyForex.com, and Blogger, TheTraderGuy.com


