
Technician Corey Rosenbloom of AfraidToTrade.com highlights the key things to watch on this popular currency pair’s charts to capitalize on upcoming opportunities.
One consequence of the recent strength in the US Dollar Index is the euro’s steep retracement, which similarly declined sharply from its upper target level.
Let’s focus our attention on the key inflection level and potential bounce off a critical support level for the euro (EUR/USD forex pair):
Click
to Enlarge
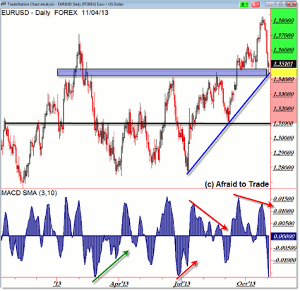
We’ll start with the daily chart and a simple focus on the blue highlighted region near 1.34500 for the EUR/USD pair. It’s a “polarity” level, which means the price level has served both as prior support and resistance and is thus an important potential turning point or inflection level at the moment.
Wednesday morning, we see a strong bounce that may indeed be developing off this level.
I highlighted the upper “bullish zone” green with the assumption that the support level will hold and the euro will continue to trade up off this level accordingly.
We also note the lower red zone or “bearish zone” should inflection support fail, triggering a sell-off or continuation of the larger retracement (which suggests that the US Dollar Index will continue trading sharply to the upside).
A re-entry into the bearish zone (meaning a break under 1.34000) suggests that the lower target descends to 1.31000.
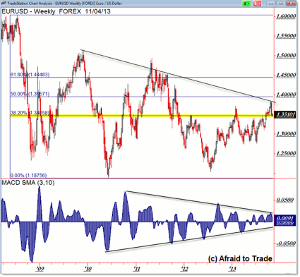
As usual, the weekly chart provides additional perspective that the daily chart cannot reveal:
Click
to Enlarge
With respect to the importance of the 1.34000 region, we see a more sophisticated target in the form of the larger 38.2% Fibonacci retracement at 1.34658.
We can see historically how price has behaved at this level from 2009 to present (again, serving as a polarity level).
Note the falling black trendline from which price retraced last week. Also, note the negative divergences on the daily chart into this upper target level.
Beyond the importance of the 1.35000 level, we also see a long-term compression in momentum (3/10 oscillator) as evidenced by the symmetrical triangle developing in the momentum oscillator.
We also note that price is relatively in the midpoint of the broader (similarly compressing) trading range between 1.25000 and 1.45000.
These are additional factors and levels to watch relative to the immediate move up or down from the 1.35000 trading level.
By Corey Rosenbloom, CMT, Trader and Blogger, AfraidToTrade.com


