It’s often said that Japanese candlestick patterns don’t offer a ‘winning edge’ on their own for currency traders, but Adam Lemon, of DailyForex.com, demonstrates why he believes there are a few that do, by looking at a powerful, yet rarely discussed and not well known pattern.
The analysis of Japanese candlestick patterns is a tried and tested forex trading method. It is often said that Japanese candlestick patterns on their own offer no winning edge, but must be used judiciously in line with the broader market picture from higher time frame charts and analysis of support and resistance. This is good advice and it is undoubtedly true that taking candlestick patterns in isolation is not the most profitable way to trade them.
A Stand-Alone Candlestick Edge
Nevertheless, I believe there are a few Japanese candlestick patterns that do provide a positive edge, even when taken in isolation, especially if the candlesticks are from a relatively high time frame. The best way to test out such a pattern is by checking the performance of the very next single candle or subsequent few candles to the pattern, to filter out the accidental results where there happens to be an entry just before a major new trend begins. No simple candlestick pattern can predict that. The effect of a candlestick pattern itself only really lasts for a few subsequent candles.
The Three Soldiers with Retest Candlestick Pattern
Let’s look at a pattern which is very powerful, but rarely discussed, and not very well known. It does not have a common name, so I call it “Three Soldiers with Retest” as it is closest to the “3 Soldiers” candlestick pattern.
The pattern is relatively simple. It is a three candle pattern.
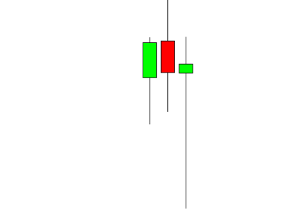
Below is an example of the bullish version:
Candle 1—closes up
Candle 2—a higher low and a higher high
Candle 3—breaks the low of candle 1, closes up and above the close of Candle 2.
Below is an example of the bearish version:
Candle 1—closes down
Candle 2—a lower high and a lower low, closes down
Candle 3—breaks the high of candle 1, closes down and below the close of Candle 2
You do not see this pattern discussed much, but it has been a well-known pattern to watch out for among the professional trading community for a long time, having been documented in publications as early as the 1970s.
The reason why this is a powerful pattern is because it shows building bullishness or bearishness in terms of momentum, coupled with a failed test of the opposite low or high. These patterns often have built-in “2B failed breakouts,” which is a key part of forex market structure.
Candlestick Pattern Back Test
We can perform a back test on the recent history of this pattern on the major currency pairs to see how effective this pattern really is. It makes sense to look at a relatively high time frame, but one that can provide plenty of examples, so the H4 chart is suitable. Entry will be made immediately upon the close of the third candle, with an exit after one single candle. This should indicate most decisively whether the pattern over time provides an immediately powerful effect upon the price.
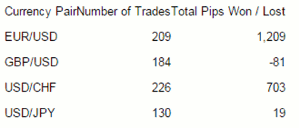
The results of a recent five-year back test on the four major forex pairs are as follows:
Regarding GBP/USD, if trades were taken only following the candle closing most close to the London Open, the result was profitable.
Overall, these results are quite impressive, considering they are taken in isolation from other factors, run over a five-year time frame, and consist of a sample of 740 trades. We have evidence: it is a powerful candlestick pattern.
When you see this pattern in an area where you are looking for a trade, you can take this as a good and probable confirmation that the price is about to move in the direction that you are anticipating.
By Adam Lemon, Contributor, DailyForex.com


