Walker England, of DailyFX.com, discusses the power of understanding what the RSI indicator is and how it can be a powerful indicator for the confirmation of breakouts in forex trading.
Traders have options when it comes to trading. Normally some of the most important decisions made revolve around whether to enter into a trade or not. While some traders will aggressively jump into the market with entry or market orders, others may choose to trade more conservatively and wait for a confirmed trading signal. Today we will review the later, by learning how to use the RSI indicator to confirm market breakouts. Let’s get started.
What is RSI?
Before you place your first trade using RSI, it is important to become acquainted with what the indicator is telling us and why. RSI is a classic oscillator, which means the indicator tracks price by moving or oscillating above or below a center line. As seen below, RSI oscillates higher and lower by tracking average gains versus average losses, ultimately causing it to move between the values of 0-100. When RSI reaches a value over 70, traders consider the indicator overbought. Conversely, a reading under 30 is considered oversold. Keep these values in mind as they will become important when it comes time to confirm breakouts.
Confirming a Breakout with RSI
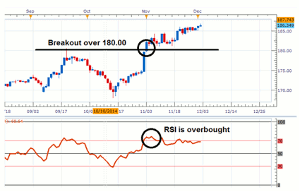
Once you are comfortable reading RSI, you can begin using the indicator to confirm breakouts. While traders normally look for RSI crossovers for trading signals, the exact opposite technique will be used in this example. If price is seen breaking through a key line of resistance, confirmation will occur when RSI moves into overbought territory at a value of 70. The idea is that if market momentum is up, RSI should be up too. The same is true if price is headed down and breaking through a value of support. Traders can wait and confirm the move using RSI as it pushes below 30. Let’s look at an example.
Below we can see an example of a breakout that occurred last month on the GBP/JPY. At that time, current resistance was found at 180.00 for the pair. Price vigorously broke through this value on November 3rd. RSI at the same point can be seen becoming overbought. Breakout traders could take that as a sign of increasing bullish momentum confirming any new buy based breakout positions.
Practice Your Trading
Using RSI to confirm trading signals is like any other trading skill and will take time and practice.
By Walker England, Trading Instructor, DailyFX.com


