Walker England,of DailyFX.com, takes a technical look at this currency pair that—after rising as much as 279 pips in Tuesday’s trading—has been moving in a sideways range and failed to breakout in spite of a heavy event risk Wednesday, which included the ECB rate decision.
Talking Points:
- EUR/USD starts trading in a 153 pip range
- Price is bouncing from support at 1.1073
- R4 breakouts begin at 1.1303
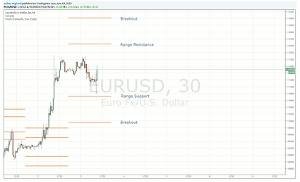
EUR/USD 30Minute Chart

(Created using Trading View charts)
Click to Enlarge
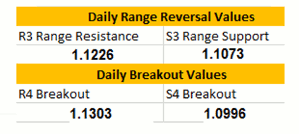
After rising as much as 279 pips in Tuesday’s trading, Wednesday the EUR/USD has been moving sideways in a defined range. This current range bound environment comes in spite of a heavy event risk, which includes the ECB rate decision. Currently, price is attempting to bounce from range support, found at the S3 Camarilla pivot at 1.1073. If prices remain supported, there is a possibility that the EUR/USD may resume its advance to values of resistance, which includes Wednesday’s R3 at 1.1226.
With more event risk still to come, traders may continue looking for breakouts on the pair. A breakout above the R4 pivot at 1.1303 would add validity to Tuesday’s bullish price action. Conversely, a move below the S4 pivot at 1.0996 would suggest a bearish reversal counter to this week’s predominant trend. In either scenario, traders should consider concluding any range bound positioning and trade with the markets new found momentum.
Intra-day EUR/USD Support and Resistance Values for Reversals
By Walker England, Trading Instructor, DailyFX.com


