With Americans bursting through the long and bitter winter like daffodils during spring thaw, MoneyShow’s Tom Aspray explores how this might be the catalyst needed to propel the markets higher.
As April draws to a close, it almost seems as though we have had two months in one. The widely watched PowerShares QQQ Trust (QQQ) declined into the April 11 lows and has been trying to rebound from those lows. Most of the major averages are lower for the month except the Dow Transports and Utilities.
With 41% of the S&P 500 reporting as of Thursday, 69% have beaten analysts’ estimates. The first quarter growth at 2.9% is well ahead of what the market was expecting just a few months ago. The big surprises on the plus side last week were Facebook, Inc. (FB) and Apple, Inc. (AAPL). The market also punished quite a few stocks, and I focused on three last Friday.
As I discussed last Thursday, the tech earnings combined with the new highs in NYSE A/D line should be enough to push the S&P 500 at least to the 1900 level in the next month. The extent of the first pullback, which began on Friday, should allow us to determine whether the Nasdaq 100 and Russell 2000 have actually bottomed out.
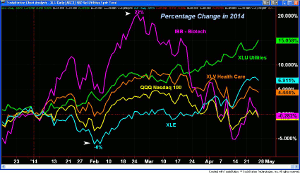
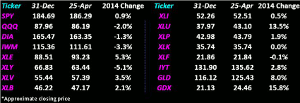
It has been a wild start to the year as the % Change chart illustrates. Most analysts (myself included) did not dream that the Utilities would be the leading sector now as it is up over 15%, so far, this year. It has been in positive territory for most of the year.
The iShares Nasdaq Biotechnology (IBB) was up over 22% in February, but by early Friday morning, had dropped back below the zero line. The QQQ is also now back in negative territory for the year.
The Select Sector Energy (XLE) has also been volatile as it bottomed in early February, and by the end of the March, had moved well into positive territory. It is up over 7% though it may correct over the near term as it is a bit overextended. Still, it has had a nice rally after being down 6%.
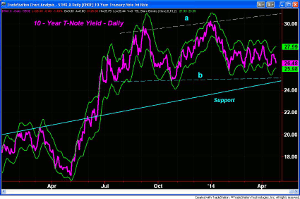
The yield on the 10-year T-note hit its high, Monday, and spent the rest of the week moving lower. It is still within both its short- and long-term trading range (lines a and b). The weekly momentum analysis topped out in early 2014 and is still negative. Therefore, it is giving no signs yet that rates are ready to move substantially higher.
The lower weekly starc- band is at 2.43%, which one would expect to be the maximum downside target and also corresponds to the uptrend. It is difficult to see what could push yields that low as the current crisis in the Ukraine is the main unknown for the markets at this time.
The news on the economy last week would have been expected to move rates higher. I have been looking for better-than-expected economic numbers as I discussed last week in A Spring Breakout for the Economy? Last Monday’s release of the Leading Economic Indicators showed an unexpected rise of 0.8% and as the analysts at Econoday put it “Spring is here and the index of leading indicators is taking off.”
NEXT PAGE: What to Watch
|pagebreak|The data from the Richmond Fed on manufacturing was also positive, and while the PMI Manufacturing Index was little changed, it did reflect growth even if it was lower than February. Next month’s numbers are likely to be more important.
Not all the news was positive as the Existing and New Home Sales data was weak, making many question the outlook for housing and the homebuilders. This is one area that needs to turn around in the coming months. The earnings data is mixed as DR Horton (DHI) reported a 9% increase in sales from a year ago, while PulteGroup (PHM) missed earnings.
Thursday’s report on Durable Goods showed a 2.6% gain while most were looking for just 2.1%. It seemed to be largely ignored by the stock market, but the chart shows that the yearly series broke its downtrend, line a. A move above last summer’s high would be even more positive.
Consumer Sentiment on Friday from the University of Michigan was also very strong as it came in at 84.1—well above the consensus forecast of 82.5. Looking inside the data, it reflected strong consumer activity for April, which is what I have been counting on.
This was consistent with Thursday’s Bloomberg Consumer Comfort Index as they reported “Americans were more upbeat about being able to provide for their families than at any time in six years.”
This week, we have a full economic slate with the Pending Home Sales on Monday, along with the Dallas Fed Manufacturing Survey. The Case-Shiller Housing Price index is out on Tuesday, along with the Consumer Confidence.
On Wednesday, we get the ADP Employment Report, the 1st quarter advance reading on GDP, Chicago PMI, as well as FOMC meeting announcement. If the markets are not exhausted by then, on Thursday, we have a speech by Janet Yellen, Personal Income and Outlays, the ISM Manufacturing Index, and Construction Spending. Then, we get the monthly jobs report along with Factory Orders.
What to Watch
Despite the continuation of the prior week’s rally, until Friday’s drop, the divergence between the PowerShares QQQ Trust (QQQ) and iShares Russell 2000 Index (IWM) to the NYSE Composite (NYA) and Spyder Trust (SPY) has not been resolved.
The extent of Friday’s drop does favor some further selling early in the week, which may be earnings dependent. We are not even halfway through earnings season, so further surprises are likely ahead, such as the market’s reaction to Amazon.com (AMZN) on Friday.
The new highs in the NYSE Advance/Decline, along with the S&P 500 as I reviewed on Thursday, does favor new highs by these averages in the not-too-distant future. The daily volume analysis is still lagging the price action.
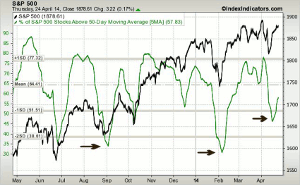
The five-day MA of the % of S&P 500 stocks above their 50-day MAs continues to rise and is just below 60. If it turns lower, it would require three or four consecutive down days, and that would be a problem. The five-day MA of the Nasdaq 100 has turned up and is now at 30, which is well above the 23.6% low from a week ago.
The individual investors became a bit more bullish last week according to AAII as the bullish % rose to 34.5%, up from 27.2&% the prior week. The bearish % also reversed as it dropped from 34.2% to 26%. I would have liked to see the bullish % get a bit lower before it turned up.
NEXT PAGE: Stocks
|pagebreak|The large-cap stocks still look like the best bet even though the relative performance has not yet confirmed they are outperforming. The oil and gas stocks also look good on a pullback. I am watching the consumer discretionary and homebuilders for signs that they have bottomed out.
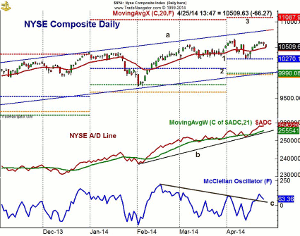
The daily chart of the NYSE Composite (NYA) shows that it dropped back to its 20-day EMA on Friday. It is still well above the quarterly pivot at 10,270 (line 1), which was tested on April 11. I have also included the quarterly projected pivot support (line 3) at 9990, as well as the projected pivot resistance at 11,087 (line 3). These are courtesy of John Person who developed the software that does these calculations.
Once above last week’s high at 10,621, the next target is the early April high of 10,669. Using current data, May’s projected monthly projected pivot resistance is at 10,903 with support at 10,341.
The weekly NYSE Advance/Decline made another new all-time high last Tuesday, and as I noted last week, the weekly also looks quite strong. The daily A/D line is well above its WMA and the uptrend, line b. The other key support level to watch is the April low.
The McClellan oscillator broke through its downtrend, line c, last week, which is a positive sign. It looks ready to hold above the zero line on Friday’s close (data is not final).
S&P 500
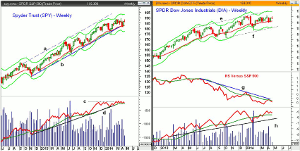
The weekly chart of the Spyder Trust (SPY) moved through the resistance at $187.17 last week and made a high at $188.40 before dropping Friday. It looks as though a weekly doji will be formed.
There is next support at $184.65-$185 with the quarterly pivot at $182.99. The longer-term support (line a) and the 20-week EMA were tested earlier in the month with the low at $181.31.
The all-time high is at $189.70 with the monthly projected pivot resistance at $192.40. The weekly starc+ band is now at $193.20.
The S&P 500 A/D (not shown) made another new high last week before turning lower. It is still above its WMA, which is rising.
The weekly on-balance volume (OBV) is still holding above its WMA but did turn lower. The uptrend from the late 2012 lows is now being tested. It had staged a minor breakout above resistance ( line c) several weeks ago.
Dow Industrials
The SPDR Dow Industrials (DIA) closed well off the week’s high, which was $165.30. It came close to the prior all-time high at $165.95, which is likely to encourage the stock market bears.
There is next support in the $162 area with the 20-week EMA at $161.15. The quarterly pivot is at $161.30 and a weekly close below the $160 level would be negative.
The monthly projected pivot resistance is at $167.48 with the weekly starc+ band now at $169.21.
The weekly relative performance is still below its WMA and now needs to move above the previous peak and the downtrend (line g) to signal that the large-cap stocks are leading.
The weekly on-balance volume (OBV) turned lower last week, but is still well above its WMA. The daily Dow Industrials A/D line (not shown) did make a new high last week before turning lower. It is still well above its rising WMA.
Nasdaq-100
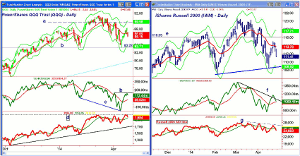
The PowerShares QQQ Trust (QQQ) lost 1% on Friday and is back below the 20-day EMA at $86.89 and the quarterly pivot at $87.34. The last swing high at $89.68 was briefly overcome last week. There is next support at $85.50-$86 and then in the $84.50 area. The $83.28 area, line b, has held in 2014.
The daily OBV has turned lower after failing to exceed its prior highs. A move back above the resistance at line b would be positive. The OBV is well above its now-rising WMA. The lower lows on the daily OBV, line c, is a concern.
The weekly OBV will close the week back above its WMA triggering an AOT buy signal, so this week’s close will be important.
The Nasdaq 100 A/D did make a marginal new high last week before turning lower.
The initial buy level in the QQQ from Friday’s daily charts column has been hit.
Russell 2000
The iShares Russell 2000 Index (IWM) was hit the hardest on Friday as it was down over 2%. It is already close to the support in the $110-$111 area with the April lows at $108.30. The quarterly projected pivot support is at $108.80 as is the chart support.
The rally last week stalled at quarterly pivot resistance at $114.53. This is now major resistance that needs to be overcome to signal that a bottom is in place. There is a band of further resistance now in the $116 area, line e.
The daily OBV is declining but is still above its WMA. The weekly OBV (not shown) looks ready to close back below its WMA
The Russell 2000 A/D line has turned lower after failing to make a new high. It has resistance at the downtrend,
line g.
NEXT PAGE: Sector Focus, Commodities, and Tom's Outlook
|pagebreak|Sector Focus
The iShares Dow Jones Transportation (IYT) dropped sharply on Friday after making a new all-time high on Thursday, but it closed lower that day triggering a daily LCD sell signal. It did close above its 20-day EMA.
The daily studies are still positive but declining with the quarterly pivot support at $132.40. The weekly OBV did not confirm last week’s new high.
The weekly relative performance still indicates that IYT is a market-leading sector. We still have quite a few transport stocks in the Charts in Play portfolio.
The Spyder Trust (SPY) is still up 0.9% for the year, while the SPDR Dow Industrials (DIA), iShares Russell 2000 Index (IWM), and PowerShares QQQ Trust (QQQ) are all still lower with IWM now down 3.4%.
The Select SPDR Utilities (XLU) has added to its gains as it is now up 13.2%, while the Select SPDR Health Care (XLV) is still up 3.5%.
The Select SPDR Consumer Discretionary (XLY) is down 5.1% while the Select SPDR Consumer Staples (XLP) is up 1.7%. The daily analysis of the XLY shows no signs yet of a bottom.
The Select SPDR Financials (XLF) is pretty much flat for the year, while the Select SPDR Materials (XLB) is up 1.9% as it gave up 1% last week.
The Select SPDR Energy (XLE) is acting well as it is up 5.2%, and after the gold ETFs, is the next-best performer.
Crude Oil
Crude oil reversed to the downside last week as it was down over $2.70 per barrel. The quarterly pivot is at $98.41 with the early April lows at $98.15.
Precious Metals
The SPDR Gold Trust (GLD) triggered a high close doji buy signal on Thursday and closed a bit higher for the week.
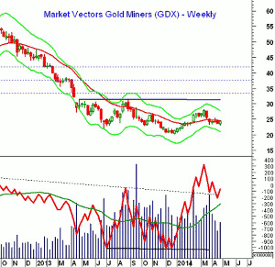
The Market Vectors Gold Miners ETF (GDX) was recommended last week in Should You Buy This Unloved Sector, and the initial buy level was hit. The weekly OBV has turned up and a higher close this week will provide further evidence that a bottom is in place
The Week Ahead
It was a pretty rough way to end the week, and it seemed to be earnings fears that drove the market lower. With a full earnings slate this coming week, including some high-flying tech names, it could be a volatile week. The economic calendar is also full, ending with the jobs report on Friday.
It is still not a time to be chasing stocks and those large-cap US and global ETFs that were previously recommended in 2 Bear-Beating Large-Cap Picks are looking good. They are likely to reach the initial buy level with further selling early in the week.
In my review of the Charts in Play portfolio this week, I did tighten some stops and took some profits. To see the whole portfolio, go here.
I am still watching some of the beaten-down tech and biotech stocks, but I need to see some confirmation by both price and volume before I recommend them.
Continue to stay with the dollar cost averaging positions in either the S&P 500-tracking ETF or Vanguard Emerging Markets (VWO) that I discussed in the January 24 column, A Path to Investing Success in 2014. The VWO was lower last week, and I will be looking to add it to daily column portfolio next week.
Those who were not in the market should have started a dollar cost averaging plan on April 11 as the S&P 500 had closed below 1830 the previous day. Another equal purchase should have been made last Friday and then two more over the next four weeks. Most importantly, have a plan for your investments and stick with it.
Don't forget to read Tom's latest Trading Lesson, 4 Dow Stocks Under Accumulation.

