
A checklist of steps to take can benefit analysis, so MoneyShow's Tom Aspray proposes a checklist of six steps that should help both traders and investors have a more successful 2015.
As 2014 draws to a close, it is important for traders and investors to make preparations now so that they can be prepared for a successful 2015. As I have stressed in over 170 trading lessons and over 2000 online articles, it takes a disciplined and a systematic approach to be successful in the markets.
In this week's trading lesson, I would like to propose a checklist of six steps that should help you be more successful in 2015. I feel confident that-if you look at your trades at the end of 2015-some of the losing trades will be a result of you not following this checklist.
The checklist items are geared, not only to each and every trade, but also how you manage your schedule during the trading year.
The first step is one that you should take at least at the end of every year and probably at the end of each quarter. This is to review all of your past trades with special emphasis on your largest losers, even though it can be unpleasant as no one likes to re-live their mistakes.
Click
to Enlarge
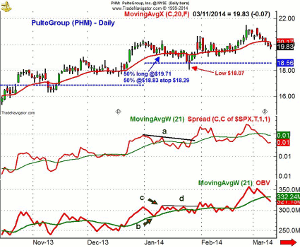
I think that the benefits of this process can last for the long-term. I looked through my recommendations in the past year and would like to examine PulteGroup (PHM) from the January 9 column 3 Buy Setups in a Lagging Group. It was one of my larger losing trades in 2014. Fig 1 My weekly analysis of the homebuilding sector (see chart) at the time was positive and my position in Lennar Corp. (LEN) from the fall had worked out well. The daily chart of PHM shows that it had peaked at the end of 2013 and corrected back to its rising 20-day EMA. The monthly pivot (not shown) was also tested. In this analysis, I will concentrate on two of my favorite technical studies, the relative performance and on-balance volume. Both will be discussed in more detail later. The daily chart shows the relative performance had been making higher highs since October. It made a new high with prices and had pulled back to its WMA when PHM was recommended.
The on-balance volume (OBV) had moved above the October and November highs in December and made a new high with prices. By the time PHM was recommended, the OBV had pulled back to its rising WMA and turned higher.
PHM had closed at $19.78 and my initial buy @$19.71, which was just slightly lower, while the second at $18.83 was almost a $1 below the close. The stop at $18.29 was below the pivot at $18.56. It was clearly not wide enough as the low on January 27 was $18.07, stopping out the long positions.
The daily chart shows that just two days after being stopped out, PHM turned around as the RS line moved through its resistance at line a. The daily OBV had not indicated heavy selling on the pullback. Four days after the stop was hit, PHM moved above the prior highs and made another new high in late February.
I learn more from my losers than I do from my winners, but the analysis can help improve your trading, especially when you scale out of positions like I generally recommend. Also, psychology plays an important role in both investing and trading, so analyzing your winners will help keep you in a positive frame of mind.
Click
to Enlarge
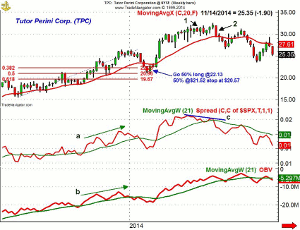
In the middle of February, after the stock market had completed a panic low early in the month, I recommended Tutor Perini Corporation (TPC), which is a heavy construction company (2 Off-the-Radar Picks).
It had peaked at $26.44 in early January and over the next five weeks had dropped to a low of $21.06, which was right between the 38.2% and 50% Fibonacci support levels from the April 2013 low.
NEXT PAGE: So What Did I Recommend?
|pagebreak|The recommendation was to go 50% long Tutor Perini Corporation (TPC), at $22.13 and 50% long at $21.52, with a stop at $20.57. The stop was well below the February 5 low of $21.07 and the quarterly S2 support at $20.73.
The weekly relative performance had made a series of higher highs, line a, in the last three months of 2013 after breaking out of a range in late September.
Therefore, when the weekly RS line turned lower in December, it was consistent with a correction not a major top. By the end of January, the weekly and daily RS lines had dropped below its WMA. At the time TPC was recommended, both had turned higher.
The weekly OBV had formed a clear pattern of higher highs and higher lows since March 2013 and also made a new high in early December, line b. By the first part of January, both the daily and weekly had dropped below their WMAs. The day before TPC was recommended, the daily OBV moved back above its WMA.
The initial buy level at $22.13 was hit the day it was recommended as the low was $22.06. TPC continued higher for the next two months and hit a high of $32.11 on May 12. The weekly chart shows that the stock then moved sideways so I recommended selling half the position at $30.56 (point 1).
TPC made another new closing high at $32.56 at the start of July and the stop was moved to $29.14. This was below the eight week low of $29.23. The stop was hit on July 17 for a profit on the 50% position of 32.8%.
Some of the losing trades are likely to be in stocks or ETFs that were acting weaker than the S&P 500. The relative performance compares the performance of a stock, ETF, or mutual fund to a benchmark like the S&P 500. It is basically a plot of the ratio of the stock or ETF to the S&P 500. It is an essential tool for both traders and investors.
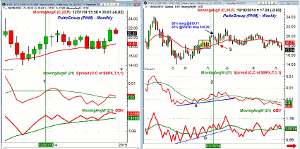
Now, I always look at the monthly and weekly charts of anything I recommend. Some short-term traders may be able to get away with not looking at the longer-term charts, but I feel investors should always examine these charts before taking a position. Let's look to see if the longer-term charts would have changed the strategy in PulteGroup (PHM).
Click
to Enlarge
The monthly chart (left side) shows that the RS was rising strongly and closed December 2013 right at its WMA. By the end of January, the RS line was clearly well above its WMA. As it turned out, the RS turned lower three months later and dropped back below its WMA.
When establishing a position, it is also important that the weekly RS line is above its WMA, which should be rising or at least flat. This was the case for PHM as the RS line had formed a nice bottom, line a, and then moved above its WMA. It made a new high as the doji was formed and was well above its WMA when PHM was recommended (line 2). In fact, the week when the stop was hit, the RS made another new high as PHM had reversed to the upside.
The monthly OBV closed below its WMA in August 2013 but moved back above it the following month. When PHM was recommended, the OBV was still holding above its WMA as it has all year.
The action of the weekly OBV is also important as it also should be above its WMA when a long position is being considered. One of my regular weekly scans is to check which stocks in the Dow, S&P 500 or Nasdaq 100 have a weekly OBV that has just moved back above its WMA. For PHM, the OBV had bottomed in August and was in a gradual uptrend by the end of the year, line a. It was holding above its WMA at the time it was recommended.
The weekly chart shows that a doji was formed the first week of January and that the 20-week EMA was broken the week that the stop was hit (point 3). PHM closed that week at $20.62, which was over 14% above the week's low. A closer look at the weekly chart also reveals a tight five-week trading range at the end of December with key support at $17.72.
NEXT PAGE: What Does This Combined Analysis Suggest?
|pagebreak|This combined analysis suggests that PHM was a solid buy, but in hindsight, buying at a level where a stop under $17.72 was used would have avoided the loss. The one day drop on January 27 did go further than one would normally expect. If one bought at the quarterly pivot of $18.56, a stop at $17.63 could have been used to limit the risk to 5%.
Once I find a stock or ETF that shows a positive daily chart or volume pattern, I then look at these two monthly and weekly technical studies.
Click
to Enlarge
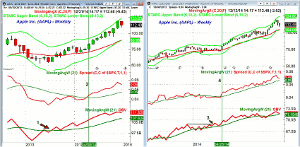
Apple, Inc. (AAPL) is a stock that can be a key barometer for the tech sector as it is a major holding of the Sector Select SPDR Technology (XLK) and the PowerShares QQQ Trust (QQQ). The monthly OBV moved above its WMA in convincing fashion, point 1, in July 2013. The WMA was retested in September as AAPL finished the year on a strong note.
The relative performance bottomed in June 2013 but was not able to move above its WMA until April 2014 when AAPL closed at $83.04.
The weekly picture is much different as the weekly relative performance completed its bottom in August 2013 (not shown). The RS line dropped below its WMA again in early 2014 but then moved solidly back above its WMA on April 25 (line 4).
The weekly OBV broke out of its trading range (point 3) in March and was making new highs when the RS moved back above its WMA. The relative performance has stayed well above its WMA since April and did make a new high in late November. The OBV dropped below its WMA in October before moving back above its WMA early November. Despite the pullback in early December, both the RS and OBV analysis are still positive. AAPL is up 41.9% YTD.
What about some of the other best and worst performers in 2014?
There has been quite a bit of analysis and conjecture this year about Amazon.com Inc. (AMZN) as it was also featured in Should Apple, Amazon, or eBay Be Portfolio Picks for 2015? along with Apple, Inc. (AAPL) in early December. I concluded that "Amazon.com Inc. (AMZN) and eBay Inc. (EBAY) both look vulnerable technically."
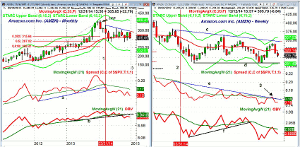
Click
to Enlarge
The monthly chart of Amazon.com Inc. (AMZN) shows that it triggered a LCD sell signal in January 2014. By the end of March, the monthly relative performance dropped below its WMA and the uptrend, line a. The RS analysis has remained negative. The monthly OBV dropped bellow its WMA in April but did not complete its top until October as support, at line b, was violated.
The weekly relative performance peaked in late 2013 (not shown) and by the time it rallied back to its declining WMA in March a top was in place. By the end of March (line 2) it was dropping sharply. The RS line tried to move above its WMA on the recent rally, line 3, but still was in a clear downtrend.
The weekly OBV dropped below its support in early 2014 and was decidedly negative at the end of March. The OBV did form a short-term uptrend, line f, from the April lows. In light of the negative RS analysis, long positions should have still been avoided. The OBV support was broken in October. AMZN in down 23.3% YTD.
Click
to Enlarge
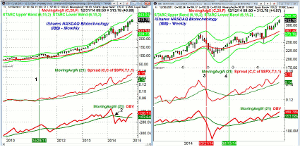
The biotech sector has been booming for several years and the iShares NASDAQ Biotechnology (IBB) has therefore been one of the best performing ETFs. It is up 36% so far in 2014 and was up 65.5% in 2013.
The monthly chart shows that the relative performance completed its bottom in April 2011 as it moved above the 2010 highs and its WMA (line 1). It has stayed above its WMA ever since.
The monthly OBV did drop back below its WMA in the last quarter of 2011 as the starc- band was tested. From early 2012 through the spring of 2014 the OBV was able to hold above its WMA.
The weekly chart shows that IBB peaked at the end of February 2014 as it had a high of $274.92 and the starc+ band was tested. Three weeks after the highs, as IBB closed at $245.58 (line 3), the RS line dropped below its WMA. The OBV was also below its WMA and it had broken support at line a.
Just ten weeks later, the OBV was able to move back above its WMA. By June 13, the RS line had also moved back above its WMA, line 4, confirming that the correction was over. Going into the end of the year both are still positive.
Once you have confirmed that the stock or ETF you are ready to buy has positive monthly as well as weekly RS and OBV analysis it is time to focus on managing the risk. In your review of past trades, I think you will notice that many of the losers are the result of a buy level that was too high and this required a stop that was likely to be hit.
NEXT PAGE: Managing the Risk
|pagebreak|I put considerable focus on the entry level and these past trading lessons, Avoiding High Risk Entries and Profiting From Fibonacci Entries and Exits may help you improve your entry technique. It is crucial that you calculate the risk on each trade before you place the order.
I try to limit the risk on any one position to 5% or less but this sometime requires an entry level that initially seems unlikely. Regular readers will have noticed that it often takes two or three weeks before my entry level is hit. Of course, sometimes the market will just take off as the proposed buy level is never hit.
If this happens to you don't let it alter your plan for the next trade as there will always be other trades. Too often, traders will chase the market the next time and end up regretting it.
I also advocate taking partial profits once a first pivot or Fibonacci resistance level is hit. This helps reduce the overall portfolio risk as well as reducing the stress level of monitoring the position.
Portfolio risk is #5 on my checklist, as for most traders, it is a good idea not to have more than 50-60% of your portfolio in the market at any one time. Of course, investors can have more invested but still only 1-2% in any one position. Stock traders will often end up with more positions then they can adequately monitor.
Traders should also monitor the number of trades they make each month so a baseline level can be determined. It is not uncommon for a trader to increase their level of trading during a losing period. If you have been successful making 15-20 trades a month don't expect the same results if you make 40-50 trades in a month.
The portfolio risk is something that should be part of your weekend research process. Having a schedule that you stick to is important whether you are trading part or full time. The week that you do not stick to your schedule will inevitably be the one where the market catches you by surprise.
The best traders I know do have a set routine and a series of steps they take before starting their trading week or day. The last item on my checklist is to acknowledge that trading is stressful and this means one should accordingly adjust their lifestyle to maximize their chances of success.
This means taking regular vacations from the market. If you have had a good week, taking a Friday off is not a bad idea. But also taking a full week or more away from the markets can be very beneficial as it will change your perspective. Overseas, it is not uncommon for trading managers to insist that their traders take 4-6 weeks off per year.
Also, I would suggest you don't take a new position if you are at odds with your significant other or have other family concerns. Personally, I have found a regular exercise routine is also quite beneficial as it is great in reducing stress. Exercise will also take you away from your screens, which may help you avoid over trading.
So, in summary, here are the six points on your checklist that, if followed, should improve your results in the year ahead.
- Review your worst trades either quarterly or yearly and keep a journal of the rationale for every trade you take.
- Be sure that the monthly and weekly relative performance are in agreement with the position you are trading. For those who trade the short side, pick those with the weakest relative performance.
- Verify that the monthly and weekly OBV analysis is positive along with the RS analysis before you go to the daily charts to determine your entry and stop.
- Carefully determine a stop level before you select an entry price. Double check the level as it is likely to be too high. Be sure to calculate the risk on each and every trade.
- Track your portfolio risk on at least a weekly basis and be sure that you are not overtrading.
- Take time off from the markets, that means a combination of vacations and maybe an exercise plan which will help you keep a positive perspective on the markets.
As always I appreciate you feedback on all my trading lessons and wish you all a profitable 2015.


