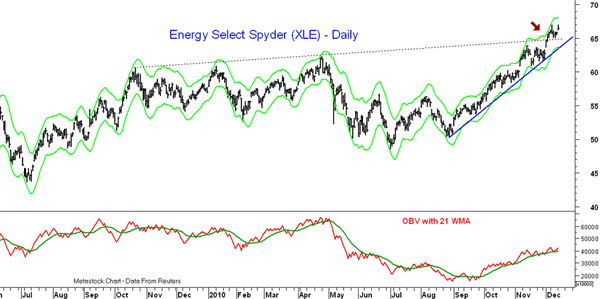
The chart of the Energy Select Spyder ETF (XLE) overcame year-long resistance in the $65 area almost two weeks ago (see arrow). This now becomes an area of good support that extends down to the $63 area. The daily on-balance volume (OBV) is positive, but the weekly OBV looks even stronger. This bullish action suggests a move to XLE’s 61.8% retracement resistance at $71, if not the strong weekly resistance in the $78 area, is possible. XLE would look attractive on a pullback to the $65.40-$65.80 area for a move to the weekly resistance level. A close below $60.80 would invalidate the bullish case.
Tom Aspray, professional trader and analyst, serves as senior editor for MoneyShow.com. The views expressed here are his own.


