
Click
to Enlarge
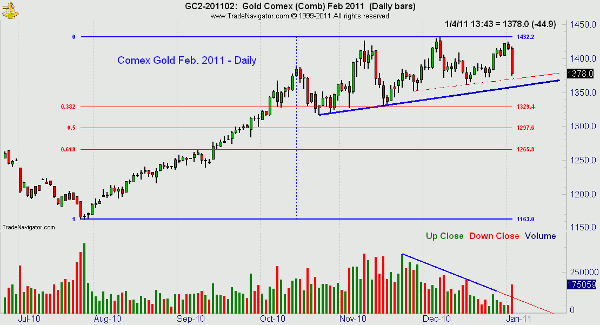
Chart Analysis: Gold and silver futures and precious metals ETFs are getting hit hard, and while profit taking is expected after a dramatic rally, the technical action suggests this may be more than just a pullback. First I need to reiterate that the major trend, based on my monthly volume analysis, is positive, but that does not rule out a significant correction. This daily chart of the February gold futures contract, updated as of 2:00 pm ET, shows that the first support zone at $1370-$1378 has been reached. There is further trend line support in the $1360 area with the 38.2% support level at $1329.40. What has me concerned are the three series of higher highs ending in early December and then the apparent rally failure last week. Volume has picked up today, allowing for the possibility that we will break good support on heavier volume than we have seen in over a month. Volume is also significantly higher than average in SPDR Gold Trust (GLD) and iShares Silver Trust (SLV).
What It Means: Though it would take at least a close below $1361 in the February futures, $132.86 in GLD, or $27.30 in SLV to confirm a daily top formation, the odds, in my estimation, are fairly good. If a top is in place, it will be the extent of the first wave of selling that should tell us whether to expect a several-week or several-month decline. I would expect a drop at least to the $1330 area basis February gold.
How to Profit: Less than a week ago, I recommended that you close out February 135 call options that you sold against your existing long positions. This was a break-even trade. To hedge your existing longs in GLD, I would recommend selling the March 135 calls against your long position as they are fairly liquid and are trading around $4.65.
Tom Aspray, professional trader and analyst, serves as senior editor for MoneyShow.com. The views expressed here are his own.


