In almost 30 years of following the markets, the market internal data (advancing issues, declining issues, new highs, new lows, etc.) have been my most reliable tool for determining the stock market’s trend. The Advance/Decline (A/D) line was pivotal in identifying the lows in September and currently is providing some interesting insight.
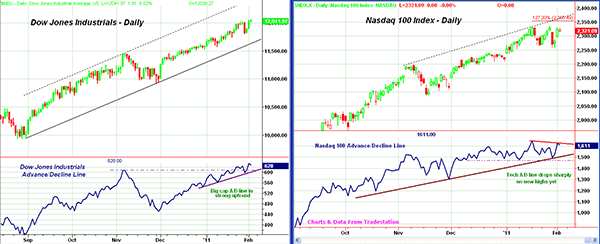
Chart Analysis: I have written extensively on this subject (links to follow), but now, thanks to TradeStation, there is Advance/Decline data available on different market indices, including the Dow Industrials and Nasdaq 100, which are featured today.
The daily chart of the Dow Industrials shows a well-defined trading channel with the upper boundary now in the 12,400 area.
- The long-term chart of the Dow Industrials also shows a band of long-term resistance between 12,000 and 12,300
- There is short-term support from last week at 11,800 and more important support at 11,550-11,700. A close below 11,500 would signal a deeper correction
- The A/D line has just made new highs, confirming the price action as the early-November highs were previously exceeded
- The A/D line’s short-term uptrend is also a sign of strength consistent with money flowing into the large cap Dow stocks. Key support for the A/D line is at the November lows
The Nasdaq 100 shows a broad trading range since the early-January highs, though it did make a marginal new high last week at 2336
- On an upside breakout, the 127.2% Fibonacci target is at 2355 with the upper trend line at 2365
- The key support on the daily charts is in the 2250-2260 area, and if broken, it will suggest a drop to the 2200 area
- The Nasdaq A/D line was very strong during September, but now shows a slower rate of ascent
- The uptrend in the A/D line was tested last week. The A/D line has not made new highs since January 18 (see red line)
- A violation of the uptrend and near-term support (dashed line) would be consistent with a deeper market correction.
What It Means:The stronger relative action of the large cap stocks in the Dow is confirmed by it’s A/D line, while the Nasdaq’s A/D line reflects the recent choppy trading range. In past market cycles, the Dow Industrials have often topped out last, following the mid and small caps as well as the technology-heavy Nasdaq 100. There is not enough evidence to draw this conclusion at this time, as this is more likely just a case of normal market rotation between sectors
How to Profit: The broad NYSE A/D line has confirmed the recent market highs, and this keeps the intermediate-term trend positive, like it has been since the spring of 2009. For now, the large caps are the market leaders, but it would just take a new high in the Nasdaq 100 and Russell 2000 that was confirmed by their A/D lines to signal they were again taking over leadership.
Here are links to two previous articles on how to use market internals:
Bear or Bull Market? Debate Rages on
Using Market Internals to Time the Market
Tom Aspray, professional trader and analyst, serves as senior editor for MoneyShow.com. The views expressed here are his own.


