As most investors know, those who manage more than $100 million, like George Soros, are required by the SEC to report their stock holdings within 45 days of the end of each quarter. These results are often quite interesting as they allow investors and traders to zero in on stocks that may be suitable for them. It is assumed that these managers make their buy and sell decisions based on fundamental and not technical analysis. Legendary investor George Soros has added to long positions in these two stocks—should you be buying them, too?
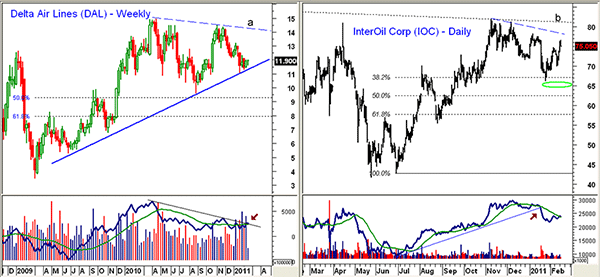
Chart Analysis: Soros Fund Management gained about 15%, or one billion dollars, in the last quarter, and in the process, the fund bought more than ten million additional shares of Delta Air Lines (DAL) to increase total holdings to 14.7 million shares. DAL has tested the weekly uptrend level (currently at $11.33) over the past few weeks.
- There is critical support in the $10.96 - $11.11 area, which goes back to the October lows
- The major 50% retracement support is at $9.27
- The downtrend on the daily chart is now being tested and a move above the recent high at $12.34 would be a positive sign
- There is a band of stronger resistance in the $12.80 - $13.25 area with the long-term trend line resistance (line a) at $14.30
- The weekly on-balance volume (OBV) has turned up and is trying to break its downtrend. A further rise would indicate accumulation
Soros’ fund also added to its position in InterOil Corp (IOC) and now holds 4.4 million shares. The daily chart of IOC shows that it is still correcting from the early-November highs at $81.98.
- The 38.2% support at $61.20 was violated in late January and the 50% support is at $62.60
- The corrective pattern does not yet look complete and a drop below the swing support at $69.90 will indicate a further decline
- There is next resistance and the short-term downtrend in the $78.20 – $78.40 area
- Long-term trend line resistance (line b) is now at $81.20
- The daily OBV has broken its uptrend, suggesting that the recent rally is losing upside momentum
- The monthly OBV (not shown) is positive for the major trend
What It Means:There is no way to tell what the fund’s plans are for these two stocks, but it’s interesting to know about these recent moves. When accumulating a large position, the manager is likely buying at several different levels, while individual investors may have more flexibility in establishing a position. DAL looks attractive around current levels, but with the current technical outlook, I would wait to buy IOC at significantly lower levels.
How to Profit: Buying against a weekly support line can be a decent strategy, especially when the volume pattern is constructive because it allows a reasonably tight stop. For DAL, I would look to buy at $11.52 - $11.67, using a stop at $10.89 (risk is approx. 6.6%). If filled, move the stop to $11.23 when DAL moves above $12.35.
As for IOC, I would look for a drop to the $64.50 - $66 area to complete the correction. Therefore, try to buy in at $65.55 with a stop at $61.77 (risk is approx. 5.7%).
Tom Aspray, professional trader and analyst, serves as senior editor for MoneyShow.com. The views expressed here are his own.


