Violence in Libya is the latest in a string of events that has pushed oil and energy sharply higher. Risk is high, however, so take action now to lock in your gains.
The conflict and uncertainty in the Middle East turned the focus on crude oil and energy stocks last week, and this intensified when violence erupted in Libya, which is a large supplier of sweet crude oil. Overall, this has been positive for the energy sector, though not all stocks have participated and volatility is high. For those who are long the Energy Select Sector SPDR (XLE), how should you protect your profits?
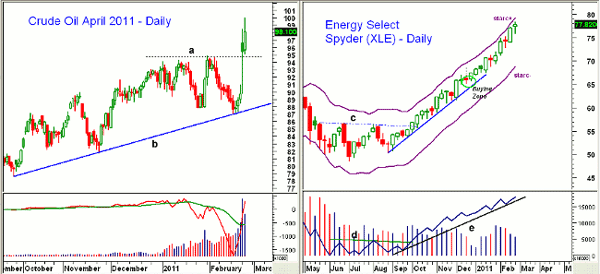
Chart Analysis: The daily chart of April crude oil shows that the daily uptrend (line b) and support near $87 were tested early last week before crude’s dramatic $13-per-barrel rally. The extremely wide ranges in crude oil futures over the past two days makes risk control very difficult for traders.
- The major 61.8% retracement resistance is at $104 with further chart resistance in the $110 area
- On the daily chart, there is initial support just below $95, line a, with further support at $92
- Volume was very heavy over the past few days as many shorts were likely forced to cover their positions
- The daily on-balance volume (OBV) has surged over the past five days and is back above its weighted moving average (WMA)
The uptrend in XLE has been very impressive, as it has formed higher weekly lows since the middle of December.
- XLE completed a weekly bottom formation in early-October 2010 when it moved through resistance, line c
- The OBV confirmed the completion of the bottom formation by moving above resistance at line d
- Now that longer-term resistance at $78 has been reached, the weekly starc+ band is at $79.20
- The monthly starc+ band (not shown) is now at $80.25
- There is chart resistance from 2008 in the $83-$85 area
- Initial support is now in the $76 area with stronger support at $72.85
- The daily technical studies are positive and show no signs yet of a top
What It Means: As we noted at the end of January (click for chart), “The action in XLE sets a positive bias for the energy stocks” and they are currently propping up the market. If the energy stocks weren’t so strong, the major averages would certainly be much lower. Even though energy is the strongest sector, I would only do new buying in energy stocks where the risk can be well controlled and would not chase the high-flying energy names because a sharp reversal is likely over the next few weeks.
How to Profit: Last December, I commented that XLE looked attractive between $65.40 and $65.80 for a move to $71, if not $78. The buying zone was hit several days later and in early January, I advised selling half the position at $69.76 and raising the stop. I would now raise the stop further, from $68.56 to $72.72, which is just under the February 9 lows. I also would recommend selling half the remaining position at $79.66 or better. For those with leveraged positions in XLE, a tighter stop at $75.68 could also be used.
- Related: Read "Buy, Sell, or Wait: A Way to Decide" for more on trading with starc bands.
Tom Aspray, professional trader and analyst, serves as senior editor for MoneyShow.com. The views expressed here are his own.


