Short interest data shows a lot of investors betting against these shares, but with the technicals pointing higher, the short crowd may soon get flattened.
The monthly short interest data has long been watched by some analysts as it provides data on stocks that have the largest short positions. It can often alert you to some interesting opportunities, but keep in mind that short sellers aren’t always right, and that many rely on fundamental analysis and not technical.
On October 7, I recommended a long position in Blue Nile (NILE), citing a bottoming technical formation and the fact that 25% of the outstanding shares were on the short side. From the most recent short interest data, here are four stocks that you should have considered buying—not selling short—in the past month.
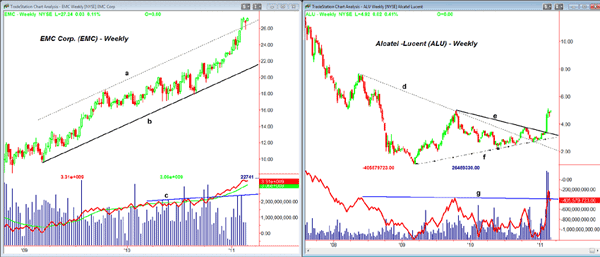
Chart Analysis: EMC Corp (EMC) is a well-known technology company that has been in a strong uptrend since the latter part of 2009. The number of shares sold short jumped 60% in the past month. The weekly chart shows that EMC has just moved above its upper trading channel.
- EMC traded above $100 in 2000 and the major 38.2% resistance stands at $42
- Initial support is now at $26.50 with more important support in the $23.50-$24.50 area. The rising 200-day moving average (MA) is just above $21
- Very positive volume action suggests the rally in EMC can continue, as the weekly on-balance volume (OBV) overcame major resistance in November (line c) and is still acting strong
Alcatel-Lucent (ALU) is a French communication equipment company where the number of shares sold short jumped 84% in the last reporting period. ALU overcame resistance going back to 2008 in September 2010 and then retested the breakout level last December.
- The shorter-term downtrend, line e, was broken in February on very heavy volume. The 2009 highs in the $5 area are being tested, and further chart resistance is at $6.50
- There is minor support in the $4.50 area. ALU gapped almost $1 higher on February 9. This gap between $3.64 and $4.16 represents the first major support, and the weekly uptrend is just below $3.00
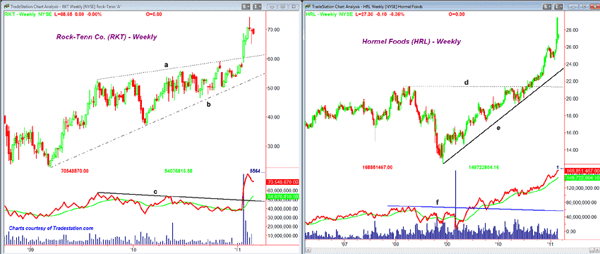
Rock-Tenn Company (RKT) is a small cap packaging company that has just broken out of a triangle formation (lines a and b) in the past week, possibly fueled by a 50% increase in the number of shares sold short.
- RKT has just made all-time highs at $74.26. This was a $12 stock in 2005
- There is short-term support now in the $65 area with much stronger support at $62.50-$64.00
- The weekly OBV confirmed the upside breakout as it overcame corresponding resistance at line c
Hormel Foods Corporation (HRL) is a popular meat-products company that spiked to a high of $29.48 on February 22 while the rest of the stock market was plunging. This was most likely due to short covering because in the past month, the number of shares sold short jumped over 100%.
- HRL is now clearly overextended, and last week, it exceeded the weekly, monthly and quarterly starc+ bands*
- There is initial support in the $26 area and then at $24.50. The weekly uptrend (line e) and the 61.8% support level are now in the $23.00-$23.35 area
- The weekly OBV moved though major resistance (line f) in August 2009, almost a year ahead of the price breakout. It still looks strong, as does the daily OBV
What It Means: While the majority of investors and traders rarely establish short stock positions, many buy put options in hopes of a stock declining. Therefore, looking at the short interest data can be quite important. In the above case of NILE, it rose from the buying zone at $42.80-$43.90 to over $64. (I advised taking final profits at $58.40 or better, however.)
The most current short interest data is available on most financial Web sites, and you should also pay attention to the number of days needed to cover. This is calculated using the number of shares being sold short and the average volume to determine how many days it would take to cover the short position.
How to Profit: Currently, I see no favorable entry points in either EMC or HRL, though longer term, both stocks are expected to continue higher, so I certainly would not be short either of these shares.
The long-term pattern in ALU looks quite promising, as the completion of the long-term triangle formation makes a rally to the $7.00-$8.00 area reasonable. I would look to buy between $3.76 and $3.88 and place a stop at $3.53 (risk is approx. 9%).
I also like RKT on a pullback to the $62.33 - $63.92 area with a stop at $58.52 (risk is approximately 8.4%).
*Read “Buy, Sell, or Wait: A Way to Decide” for more on trading with starc bands, and for ideas about stocks you should short, see "Four Stocks for Your "Short" List"


