While big banks and the financial sector overall continue to struggle, the charts for these regional banks appear to be bottoming, making them possible star performers once financials turn around.
It has been a generally mixed quarter of earnings so far for the financial stocks, and technically, the Select Sector SPDR - Financial (XLF) is still lagging well behind the overall market. It is trying to hold the key support at $15.79 and shows a pattern of lower highs.
The earnings from the large banks have not really been encouraging, as the 45% profit drop by Morgan Stanley (MS) necessitated a restructuring plan that it hopes will stabilize its financial outlook.
Citigroup, Inc.’s (C) earnings were not much better, as profit was down 32%, although it improved from the fourth quarter of 2010, beating analyst estimates. Citigroup had a nearly $3 billion drop in profits from its institutional securities business and the reverse stock split is still on the minds of many investors.
Wells Fargo & Co. (WFC) also beat estimates, but its stock was still hit hard, down 4.5% last week on the heaviest volume since last October.
Though I have been negative on the big banks for some time, there are clearly going to be some winners in the financial sector.
Many of the regional banks could double from current levels and still be worth only half of what they were in 2006. I have found three regional banks stocks where the charts suggest that the worst of the selling may be over.
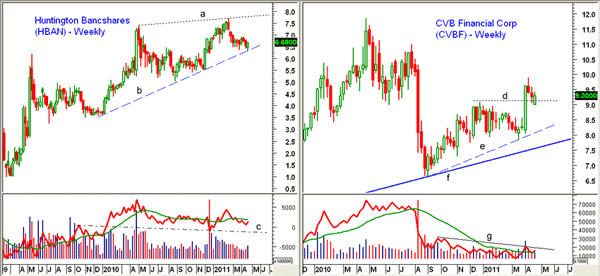
Chart Analysis: Huntington Bancshares Inc. (HBAN) is likely the best known of the three banks I have selected, as it is a $5.7 billion Midwest holding company for Huntington National Bank. It was one of the few banks that reported a 7% increase in commercial and industrial loans for the first quarter. In late 2006, HBAN was trading near $25.
- HBAN tested the uptrend from the early 2010 lows (line b) last week before closing higher for the week
- The early-April high at $6.92 is now the key level to watch, as a close above this level would clearly be a short-term positive. Further resistance is at $7.20
- A close above the weekly resistance at $7.80 should signal a move to the resistance from 2008 at $11, if not to the $13.50 area
- The weekly on-balance volume (OBV) held strong support late last year and turned up this week. A move back above the weighted moving average (WMA) would be a positive sign
- If last week’s lows at $6.34 are broken, there is additional support at $6.00 and then $6.20
CVB Financial Corp. (CVBF) is a $980 million, California-based bank holding company for Citizens Business Bank that currently yields 3.7%. The weekly chart shows a sharp rally through resistance (line d) early this month. CVBF was trading well over $15 in 2006.
- CVBF has first strong support now in the $8.80-$9.05 area with more important support at $8.40
- Initial resistance is at $9.58 and then $9.90, which, if overcome on a closing basis, should signal a rally to the $11-$11.60 area
- The weekly OBV has turned up from its flat weighted moving average and a higher close this week, and a move above resistance at line g would be quite positive
- The daily OBV (not shown) is positive
NEXT: Another Regional Bank Worth Watching; How to Profit
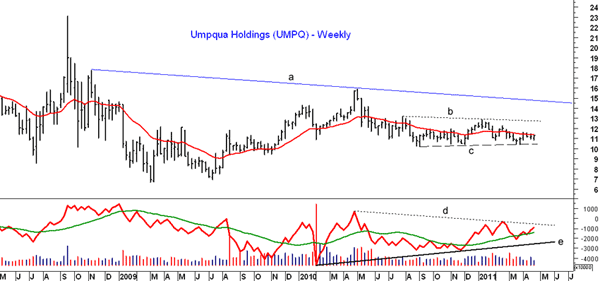
|pagebreak|Umpqua Holdings Corporation (UMPQ) is a $1.3 billion holding company for Umpqua Bank, which operates primarily in the Pacific Northwest. The company is based in Portland, Oregon.
- The weekly chart for UMPQ shows good support now in the $10.20-$10.40 area (line c), a level that has held since last summer
- Last Friday’s close was just below the 20-week exponential moving average (EMA) at $11.41 with stronger resistance at $12.25
- If UMPQ can clear the weekly resistance (line b) at $12.90, it should rally to stronger resistance at $14.75, line a
- The weekly OBV has been acting stronger than prices (line e) and is back above its weighted moving average. A move through OBV resistance at line d would be very positive
What It Means: Though the poor relative action of the financial sector overall still suggests it should not currently make up a large part of your portfolio, these three regional banks do appear to be bottoming. They could be the star performers once the financials turn around.
How to Profit: For these stocks, I would once again recommend a two-stage buying process, but be sure that you use hard stops.
UMPQ looks the strongest, technically. Go 50% long at $11.24 and 50% long at $11.08 with a stop at $10.33 (risk of approx. 7.4%). On a move above $11.77, raise the stop to $10.89.
CVBF has the strongest short-term OBV pattern. Go 50% long at $9.23 and 50% at $9.13 with a stop at $8.89 (risk of approx. 5.3%).
For HBAN, go 50% long at $6.58 and 50% long at $6.44 with a stop at $6.13 (risk of approx. 5.8%). On a move above $7.15, raise the stop to $6.47.


