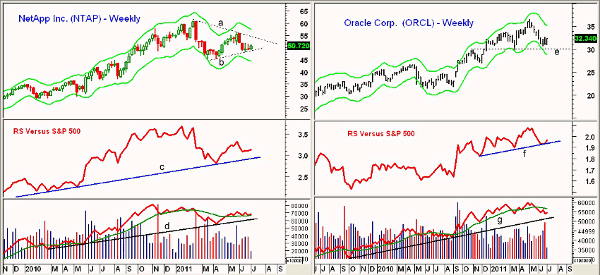
Investors looking for exposure to the now-strengthening tech sector should focus on these two stocks, which are likely to outperform even the tech sector’s finest in the near term.
Since the mid-June lows, the technology sector has been stronger than the S&P 500 and the Dow Industrials. As these two major averages were testing their prior lows and key support last Thursday, the PowerShares QQQ Trust, Series 1 (QQQ) was holding well above its prior lows. This was a positive sign, as was the better relative performance, or RS analysis, for both the Dow Transportations and the Russell 2000.
As I noted last Friday, the Advance/Decline (A/D) indicators needed a strong rally early in the week to complete their bottom formations. The strong action over the past two days has provided further evidence that the stock market’s correction is now over. A pullback is likely in the next week once stronger resistance is reached.
Many market participants were surprised by the sharp 6% gain in Microsoft (MSFT) over the past two days. MSFT and many of the other big technology stocks are now considered by investors to be “value traps.” While the technical outlook for MSFT has improved, it still shows weaker relative performance than two other big tech stocks, which now look attractive from a risk/reward perspective.
Chart Analysis: NetApp, Inc. (NTAP) is a $17 billion company that provides a wide range of data storage, management software, and hardware products to a global customer base. NTAP peaked at $58.25 in early February and is currently trading 12.9% below these highs.
- The weekly uptrend, line b, in the $48.30-$49 area has been tested over the past few weeks. There is stronger support in the $45.30-$47 area
- The weekly RS analysis shows that NTAP has been performing better than the S&P 500 since early 2010, line c
- The on-balance volume (OBV) tested support, line d, in April and is now back above its weighted moving average (WMA). The daily OBV (not shown) is positive
- NTAP is trading in the middle of its weekly Starc bands with next resistance (line a) in the $54.50 area. There is further resistance at $56.50
- The next upside target is the 127.2% Fibonacci target at $65.80
Oracle Corp (ORCL) came very close to its weekly Starc- band two weeks ago with its low at $30.65. It made a high of $36.50 in early May and is currently 11.4% below this high.
- The weekly chart has trend line support (line e) at $30 with the March lows at $29.60. The weekly Starc- band is now at $28.80
- The RS has turned up from support at line f and shows a pattern of higher highs and higher lows
- The weekly OBV confirmed the recent highs, but is now below its weighted moving average. It is well above the longer-term support at line g
- The daily OBV (not shown) is positive and shows a bullish formation
- Initial resistance now stands at $33.50, which corresponds to the 50% retracement resistance and the daily Starc+ band. There is further resistance at $35.50 with the 127.2% Fibonacci target at $38.20
What It Means: Many investors and traders have become very frustrated by the poor action in some of the largest tech stocks. Now that they are out of favor, it could mean that they will start to perform better. Both NTAP and ORCL look attractive for new purchases by those who have a low exposure to the equity market, or to the technology sector in particular.
How to Profit: Oracle Corp (ORCL) looks to be the better buy among the two, and buyers can enter at $32.04 with a stop at $30.41 (risk of approx. 5%). On a move above $34.15, raise the stop to $31.44 and sell half the position at $35.66.
For NetApp Inc. (NTAP), buy at $50.22 with a stop at $47.76 (risk of approx. 4.9%). On a move above $55.76, raise the stop to $49.74 and sell half the position at $58.84.


