These drug stocks show good relative strength, a global presence, and pay sizable dividends, a highly productive recipe in today’s market environment.
The big drug companies have shown some of the best relative performance, or RS analysis, since the August lows. Equally important is that most surged with the market this week as they continued to act better than most stocks.
Of the four stocks that I have selected, all have very attractive yields that from their financials appear to be quite safe. Another important factor, in my opinion, is a robust presence in some of the overseas markets which have the best demographics, like the BRIC countries (Brazil, Russia, India, and China). Once the emerging economies start to expand again, these drug companies should be well positioned to profit.
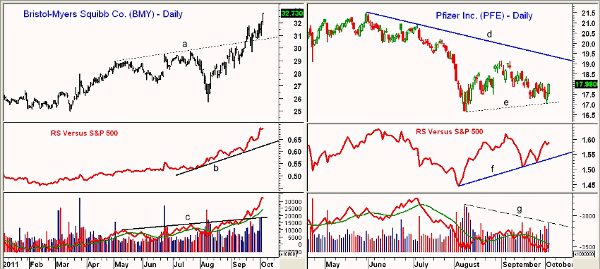
Chart Analysis: Bristol-Myers Squibb Co. (BMY) closed at a new all-time high on Wednesday and is up 27.4% from the August low of $25.69. The breakout above resistance (line a) when the market was struggling was a very positive sign. It currently yields 4.3%.
- The monthly Starc+ band is now at $34 while the chart formation has upside targets in the $34.50-$35 area
- The RS analysis has been in a steady uptrend since early in the year but turned sharply higher in August and shows a steep uptrend, line b
- The daily on-balance volume (OBV) formed higher highs in May and July, line c, but got much stronger in September. The weekly OBV (not shown) is leading prices higher
- There is minor support now in the $31.80 area. Stronger support stands at $30.80-$30.60 and the rising 20-day exponential moving average (EMA)
Pfizer Inc. (PFE) has rallied sharply from Tuesday’s low at $17.05, and unlike the S&P 500, it has held so far well above the August lows when PFE traded as low as $16.63. It currently yields 4.5%.
- There is next resistance at $18.30-$18.50 and then at $18.86, which was the September high
- The daily downtrend, line d, is now at $19.40 with weekly resistance in the $20 area
- The daily RS analysis is in a solid uptrend, line f, and a move above the September high would be very positive
- The volume increased over the past two days and the daily OBV is very close to moving back above its weighted moving average (WMA)
- The weekly OBV (not shown) made a new high with prices in April 2011 when PFE hit $21.45
- There is minor support now in the $17.30 area
NEXT: 2 More High-Yielding Drug Stocks
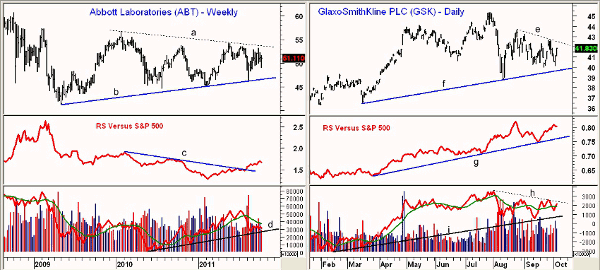
|pagebreak|The weekly chart of Abbott Laboratories (ABT) shows a contracting trading range over the past two years, lines a and b. The company is the largest drug maker in India and almost 25% of its sales come from overseas. It currently yields 3.8%.
- There is initial resistance now at $52.29 with more important resistance at $53.50-$53.70 (line a)
- A completion of the triangle formation has initial upside targets in the $59-$61 area
- The weekly downtrend in the RS was overcome at the end of July, suggesting that ABT was starting to outperform the S&P 500
- The weekly OBV is still holding above its long-term uptrend, line d. The daily OBV looks much stronger
- There is short-term support now at $50 with stronger support in the $48.50-$49 area
GlaxoSmithKline PLC (GSK) gets about 17% of its business from overseas markets and this global component of its business continues to expand. The stock closed at $41.83 on Wednesday and is up 7.9% from the August low of $38.76. It currently yields 5.1%.
- GSK has short-term support in the $40.90 area with the daily trend line support in the $39.60 area
- The long-term support at $46 (line b) was tested in August
- The daily RS shows a strong uptrend from the April lows and made new highs in August
- The daily OBV came very close to its uptrend, line i, and now shows a bullish short-term formation. The OBV could break out above resistance at line h this week
- The short-term downtrend, line e, is now at $42.65 and a close above this level would project a rally to the $44.80- $45.30 area
What It Means: Overall, the big drug manufacturers underperformed during the early part of the bull market that began in 2009. This started to change in 2011, as the RS analysis indicates.
The recent outperformance combined with very attractive yields suggests that these drug stocks should continue to outperform the S&P 500. The large-cap stocks also tend to hold up better during volatile times.
How to Profit: For Bristol-Myers Squibb Co. (BMY), go long at $31.54 with a stop at $28.18 (risk of approx. 10.7%).
For Pfizer Inc. (PFE), as previously recommended, buyers should be long at $17.03. Raise the stop to $16.44 from a close-only stop at $15.74. Those not currently long could buy at $17.62 with a stop at $16.44.
For Abbott Laboratories (ABT), go long at $50.44 with a stop at $45.96 (risk of approx. 8.8%).
For GlaxoSmithKline PLC (GSK), go long at $41.51 with a stop at $38.32 (risk of approx. 7.7%).


