Technical and fundamental pressures are weighing heavily on the industry, and investors who buy solely for the big yields will become susceptible to excessive downside risks.
The July cut in Medicare reimbursements to nursing home operators and landlords who rent to them has hit many of the health care REITs quite hard over the past few months. The concern is whether nursing home operators will be able to make rent payments after the cuts in Medicare spending.
Back in the 1990’s, there were also sharp cuts, but most of the companies then were on much weaker financial footing, and many eventually declared bankruptcy. Even if the companies are able to make rent payments, profits are likely to take a sizable hit, which will make it difficult for landlords to increase rents.
The failure of the Congressional supercommittee to come to an agreement will also have an impact, as the rate of Medicare growth will face an automatic 2% cut in 2012. The recent data on nursing homes in 31 major cities indicates that occupancy rates and rents have both declined over the past five years.
Despite the mixed to negative outlook for the industry, many are still looking at some of the health care REITs solely on the basis of their yields, but as you’ll see, the charts suggest that may not be a good idea.
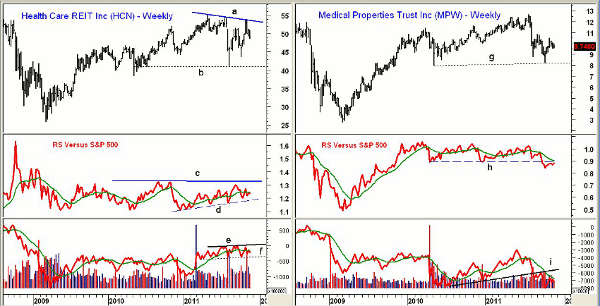
Chart Analysis: Health Care REIT Inc. (HCN) is an $8.6 billion REIT that invests in a wide range of health care facilities including acute care hospitals, retirement communities, assisted living facilities, and medical office buildings.
- HCN traded as high as $55.21 in April and as low as $41.03 in early August in reaction to the Medicare cuts. It is up 4.90% for the year and currently yields 5.82%
- The rally from the October lows at $43.65 appears to have stalled below the resistance in the $54 area, line 1
- Next good support is in the $45.40-$47 area with major support, line b, at $41
- The weekly relative performance, or RS analysis, shows that HCN has been unable to move through multi-year resistance at line c. A violation of support, line d, will suggest further weakness
- The weekly on-balance volume (OBV) is also range bound (lines e and f) but is acting more toppy
Medical Properties Trust, Inc. (MPW) is a $1.05 billion health care REIT that invests in, develops, and leases health care facilities. It reached its early high in July at $12.65 and is currently down 23% from those highs.
- For the year, MWP is down 11.7% and it currently yields 8.5%
- The weekly chart shows that key support (line g) going back to 2010 was tested in August. A decisive break below $7.90 would be very negative
- The RS line has already broken corresponding support at line h and the RS chart, like prices, shows a well-established downtrend
- The weekly OBV violated support in August, line 1, and barely rallied during October. A drop in the OBV below the 2010 lows is likely to precede a break in prices
- There is initial resistance for MPW at $10.50-$10.87
NEXT: Two More REITs in Danger of Further Declines
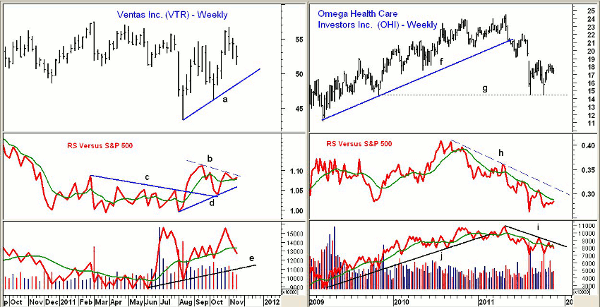
|pagebreak|Ventas, Inc. (VTR) is a $14 billion health care REIT that invests in a wide range of facilities including hospitals, medical office buildings, and senior housing facilities. VTR currently yields 4.5% and is down 1.2% for the year.
- VTR made a high in March 2011 at $57.45 and traded as high as $56.73 just a few weeks ago
- The weekly uptrend, line a, is at $48.60, and a break below the October lows at $46.16 would be more negative
- The RS shows a short-term pattern of lower highs (line b). A drop back below its weighted moving average (WMA) is possible this week. More important support stands at line d
- The break through RS resistance at line d in August was positive
- The weekly OBV has dropped below its weighted moving average but is still well above support at line e. The OBV was stronger than prices on the recent rally
- The daily OBV (not shown) does show a pattern of higher highs and higher lows
- VTR spent over $11 billion on acquisitions in 2011
Omega Healthcare Investors, Inc. (OHI) is a $1.7 billion REIT that focuses mainly on long-term health care facilities. It has had a rough year, down over 20%, and has a current yield of 9.2%.
- OHI peaked in April at $24.46, and just three weeks later, it violated its uptrend, line f
- After the weak rally in July, it formed a clear pattern of lower highs and lower lows with key support now at $14.40, line g
- The RS analysis peaked ahead of prices in 2010 and shows a well-established downtrend, line h. It made slightly higher lows in October but shows no signs yet of a bottom
- The weekly OBV violated its uptrend (line j) in early 2011 before making new highs. It has been declining steadily from the highs, line i
- Initial resistance is now at $18.30-$18.60
What It Means: July’s cut in Medicare reimbursements and the failure of the supercommittee clearly increases the risk for these health care REITs. The charts of the two smaller REITs, Medical Properties Trust, Inc. (MPW) and Omega Healthcare Investors, Inc. (OHI), look most vulnerable heading into 2012.
Though Health Care REIT Inc. (HCN) and Ventas, Inc. (VTR) may be large and stable enough to withstand future pressures on the industry, those charts also look vulnerable. A break below the October lows is likely to trigger further selling.
How to Profit: For those who are long either Medical Properties Trust, Inc. (MPW) or Omega Healthcare Investors, Inc. (OHI), close out now, as stops under the October lows would mean an additional 16% or more in risk.
Of the two larger REITs, Ventas, Inc. (VTR) would look more interesting if the RS can break out to the upside, but the current correction should be monitored before buying.


