A sharp correction could soon hit red-hot regional bank stocks, and buyers who wait to buy on that correction will be rewarded with much more favorable buying opportunities.
All of a sudden, regional bank stocks seem to be the flavor of the week, which is not surprising considering they have done so well since the October lows. Though the chart formations suggest that they can move even higher in 2012, now may not be the time to buy.
Most regional banks have a level of strong resistance not far above current levels, which is likely to cause a sharp setback for late buyers. As I have discussed frequently, a poor entry level is often the root cause of many losing trades.
Though this week’s action in the stock market and the banking sector has been impressive, the probability of a fairly sharp correction in the next week or two has increased. Such a correction is likely to stop out many market skeptics, who after many months of proclaiming the end of the world are just now buying stocks.
Given the typical seasonal pattern, a correction before the end of January is likely to set up a good buying opportunity and provide a better entry point in the still-depressed regional banks.
Those regional banks that I recommended in the latter part of October (see “Regional Banks Ready to Break Out”) are doing quite well, and I would now look to take partial profits on those positions in the near term.
There are also quite a few stocks—including some regional banks—that have just completed significant chart formations. Therefore, a 3%-5% pullback should set up a good buying opportunity.
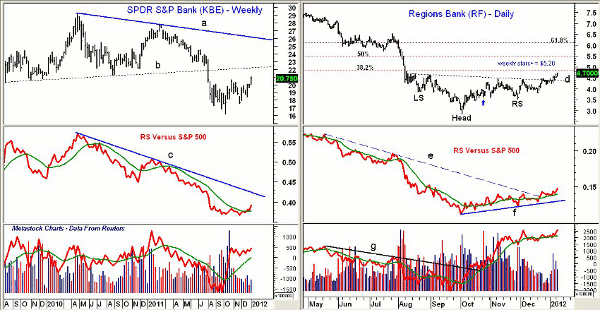
Chart Analysis: This weekly chart of the SPDR S&P Bank ETF (BATS: KBE), also known as the SPDR KBW Bank ETF, shows a nice rally from the October lows at $16.17, and with Tuesday’s close, it is up 30%. The former support (now resistance, line b) is at $22.25.
- The long-term downtrend on the weekly chart from the early-2010 highs, line a, is significantly higher at $26.30
- Relative performance, or RS analysis, has just completed its weekly bottom formation, moving above its previous peak and its now-rising weighted moving average (WMA)
- There is long-term RS resistance at line c
- October’s volume surge pushed the weekly on-balance volume (OBV) sharply above its moving average. The weighted moving average is rising and the OBV is acting stronger than prices, as it is already close to the early-2011 highs
- There is first good support at $20.30-$20.50 with much stronger support in the $19.50-$18.50 area
Regions Bank (RF) completed its reverse head-and-shoulders bottom formation just before Christmas as the neckline (line d) was overcome. Though RF is up 55% from the October lows at $3.02, in 2006, RF traded as high as $39.50.
- The minor 38.2% Fibonacci retracement resistance from the early-2011 highs is at $4.85 with the weekly Starc+ band at $5.20. The more important 50% retracement resistance stands at $5.50
- Daily RS analysis has a solid uptrend from the late-September lows (line f) and broke its longer-term downtrend, line e, in the latter part of December. The overall pattern does looks positive
- Daily OBV broke through resistance, line g, just as RF was making its low in October
- Volume was the heaviest in early August when the left shoulder was being formed and was lower in December when the right shoulder was being formed
- Weekly OBV (not shown) formed a positive divergence at the October lows and is now above its weighted moving average
- There is initial support now in the $4.40-$4.20 area with stronger support at $3.80
NEXT: Promising Regional Bank to Buy on the Correction
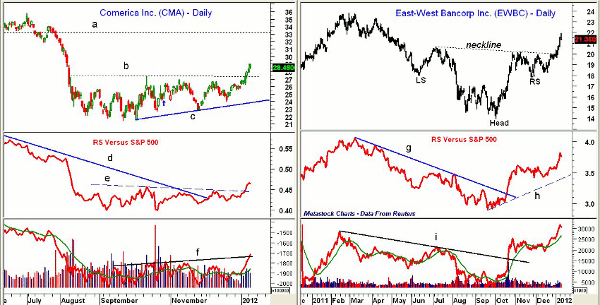
|pagebreak|Comerica Inc. (CMA) is a $5.6 billion midwest regional bank that traded as high as $40.53 in early 2011 but made a low in September of $21.48. In 2007, it hit a high of $63.89.
- The bottom formation on the daily chart (lines b and c) was completed this week when CMA closed above resistance in the $27.40 area (line b)
- The next major resistance from 2010 is at $33.20, line a
- The RS line bottomed in October and was in a shallow uptrend before breaking its long-term downtrend, line d, in early December
- The bottom was completed this week as resistance, line h, was overcome
- Volume has been strong over the past week and the daily OBV has moved through resistance at line f. The weekly OBV (not shown) is also positive
- The chart has first good support in the $27.40-$26.80 area with the uptrend, line c, at $23.90
East-West Bancorp, Inc. (EWBC) is a $3.14 billion California-based regional bank. It traded as high as $8.09 in February 2011 but had a high of $39.15 in 2006.
- The daily chart shows that the reverse head-and-shoulders bottom formation was completed on January 4 when EWBC closed above the neckline at $20.20
- The upside target from this formation is in the $26 area with the major 61.8% Fibonacci retracement resistance at $27.50
- The downtrend in the RS was broken on October 20 and is now in a solid uptrend, line h
- The OBV confirmed the RS analysis as it broke through resistance, line i, in late October
- There is first support at $20.20-$20.60 with further support at $18.80-$19.50
What It Means: Even though the weekly relative performance analysis on the S&P financial sector has not yet bottomed, the banks are one of the strongest groups in this sector.
The daily technical studies for the overall market are positive, but not all have confirmed the price action. Still, a move above 1300 in the S&P 500 is likely before the market sees an overdue correction.
How to Profit: For East-West Bancorp, Inc. (EWBC), go 50% long at $20.48 and 50% long at $20.12 with a stop at $18.42 (risk of approx. 9.2%).
Previous buyers should be long Regions Financial Corp. (RF) at $3.82. Use a stop now at $3.76 and sell half the position at $4.82 or better.
Buyers should also be long Comerica Inc. (CMA) at $24.14, and I would now advise raising the stop on that position from $22.42 to $25.44. Sell half the position at $29.18 for a gain of more than 20%.


