Investors looking for the market’s strongest sectors should look to materials and industrials, whose strong performance and chart patterns make for attractive new buying. Financials may also be making an important turn.
Friday’s strong job numbers gave many investors the justification that they needed to move back into the stock market. From a technical standpoint, this is a time to be a cautious buyer, as measuring the potential risk when considering any new positions is more important than thinking about any potential reward.
Clearly, you can shift the odds further in your favor by choosing stocks in the sectors that are outperforming the major averages like the S&P 500. So far this year, five of the major sectors are doing better than the S&P, though the weekly relative performance, or RS analysis, has not yet turned positive on all five.
In terms of performance, the Select Sector SPDR-Financial (XLF) has done the best, as it is up 13.3% so far in 2012. It has been led to the upside by the 15.1% gain in JPMorgan Chase (JPM), which is the fund’s third largest holding.
The Select Sector SPDR-Materials (XLB) has also done well, up 13.1% with Monsanto (MON), its second largest holding, up over 17% so far this year.
As suggested in January, the seasonal analysis indicated that the Select Sector SPDR-Utilities (XLU) “typically tops in late December and bottoms in March.” The fund is down 3.2% so far this year.
The small and mid-cap stocks have started to outperform the large-cap S&P 500, so which sectors now look the best for new buying?
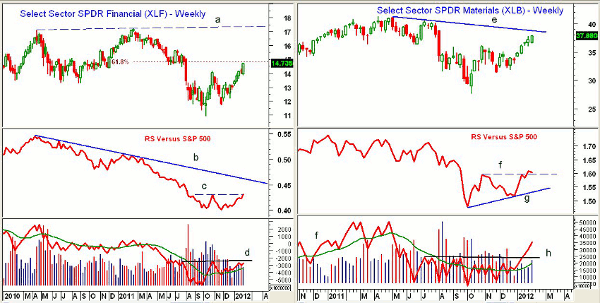
Chart Analysis: The weekly chart of the Select Sector SPDR - Financial (XLF) closed just below the 61.8% Fibonacci retracement resistance at $14.82. There is further resistance at $15.70-$16.20.
- The resistance from the 2010-2011 highs, line a, is in the $17.30 area. The major 38.2% retracement from the 2007 high at $38.22 is now at $18.20
- RS analysis closed just barely above resistance at line c last week. A convincing close would be consistent with a significant low
- There is long-term RS resistance at line b
- Weekly on-balance volume (OBV) is above its weighted moving average (WMA) but still below key resistance at line d
- The daily technical studies (not shown) do look much stronger
- There is first support now at $13.80-$14.20 with stronger support at $13
The Select Sector SPDR-Materials (XLB) has weekly trend line resistance at $38.80, line e, with further chart resistance in the $40.20-$40.70 area. XLB completed its reverse head-and-shoulders bottom formation on January 19.
- The measured target from the H&S bottom formation is in the $44.50 area
- RS analysis moved slightly through resistance, line f, two weeks ago after forming higher lows, line g
- Weekly OBV looks much stronger, as it has moved strongly above resistance at line h and is well above its rising weighted moving average
- There is good support now in the $36.30-$37 area
NEXT: Another Great Sector for New Buying
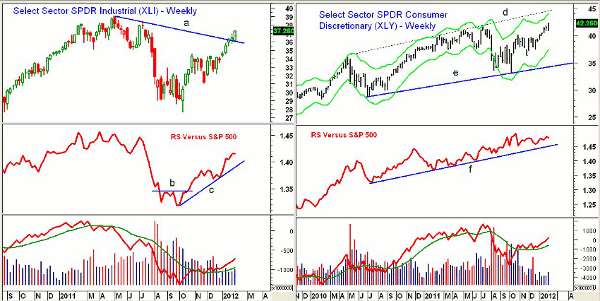
|pagebreak|The Select Sector SPDR-Industrial (XLI) is up 10.4% so far in 2012 after a great 16.6% gain in the fourth quarter of 2011. It accelerated to the upside after surpassing the major 61.8% Fibonacci retracement resistance at $34.70 in early January.
- The next band of strong resistance is in the $38.43-$38.98 area
- RS analysis completed its bottom formation in the latter part of October when resistance, line b, was overcome. It is now in a strong uptrend, line c
- Weekly OBV has turned up more sharply, and while it is above its weighted moving average, it is well below the 2011 highs
- There is first support for XLI at $35.50 with stronger support at $34-$34.60
The Select Sector SPDR-Consumer Discretionary (XLY) is up 8.3% so far in 2012 after a strong, 13.2% surge in the last quarter of 2011. The July highs at $41.78 were overcome last week.
- The weekly Starc+ band is at $44.07 this week with the trend line resistance at $44.70
- Weekly RS analysis bottomed in 2009 and has formed a series of higher highs over the past three years. It shows a solid uptrend, line f
- Weekly OBV moved above its weighted moving average towards the end of October but is still well below the highs made last summer
- The daily indicators are positive, but the OBV has not confirmed the price action
- First good support for XLY is at $40.80 and then at $40.20, which was the October 2011 high
What It Means: The evidence is mounting that the Select Sector SPDR – Financial (XLF) is forming a sustainable weekly bottom. The RS analysis over the next few weeks will be watched closely to see if it can continue to improve. Clearly, many of the bank stock are overextended and ready for a correction.
Two sectors, materials and industrials, as well as the ETFs that track them, now look the best for new equity positions. Also, look to take some profits on existing sector ETF positions on further strength.
How to Profit: Last month’s buying zone in the Select Sector SPDR-Industrial (XLI) was narrowly missed. I will be watching it and the Select Sector SPDR-Energy (XLE) closely on any pullbacks.
Portfolio Update
Buyers should be 50% long the Select Sector SPDR-Materials (XLB) at $36.88 from January 27, but the second buying zone at $36.44 was just missed. Use a stop at $35.77.
Buyers should also be 50% long the Select Sector SPDR-Utilities (XLU) at $34.86 and 50% long at $34.52. Use a stop at $33.78.
As recommended in mid-August, investors should be 50% long the Select Sector SPDR - Consumer Staples (XLP) at $29.08 and 50% long at $28.88. Use a stop at $31.48 and sell half the position at $32.56 or better.
For the Select Sector SPDR-Technology (XLK), buyers should be 50% long at $23.66 and 50% long at $23.12. Use a stop now at $25.28 and sell half the position at $28.06.


