
Contrary to the seasonal tendency, technical signals suggest oil and gas prices may decline, helping the economy and consumers, and two energy ETFs will be especially useful in tracking this trend.
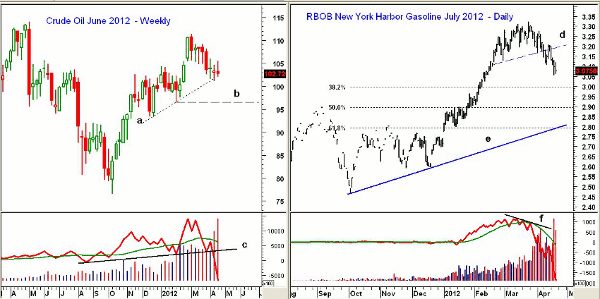
Even though the long-term seasonal tendency is for crude oil to bottom in February and rally through July, this has not been the case in 2012. The June crude oil contract hit a high of $111.31 seven weeks ago and has been declining ever since, which has taken oil to more important chart support. From the early-March highs, the June crude contract has dropped 7.7%.
Lower crude oil prices should be a plus for the economy, and there are also signs that unleaded gas futures have topped out. Though local gas prices are still trading near their highs, the technical action in the unleaded gas futures suggests prices should drop before the summer.
In terms of the energy sector, the relative performance and volume analysis of two key energy sector ETFs identifies some key support levels that should be watched.
Click to Enlarge
Chart Analysis: The weekly chart of the June crude oil futures shows that the weekly uptrend, line a, is now being tested.
- A drop below the support at $101.20 to $100.85 will signal a drop to the $100 level and possibly the next major weekly support at $98-$96.50 (line b)
- The volume has been heavy over the past two weeks and the weekly on-balance volume (OBV) has broken below support at line c
- Daily OBV (not shown) looks better than its weekly counterpart, but the volume was very high on Thursday
- On the upside, the three-week resistance at $105.50-$106 should be watched, as a close above this level is needed to stabilize the outlook for crude oil
The July 2012 RBOB New York Harbor Gasoline contract peaked at $3.32 on March 23 and then broke support, line d, in early April.
- The break of support has initial downside targets in the $2.98-$3.00 area, which also corresponds to the 38.2% Fibonacci retracement support
- The 50% retracement support is at $2.89 while the daily uptrend and 61.8% support is in the $2.79-$2.81 area
- Daily OBV formed a negative divergence, line f, which was confirmed by the plunge through support on March 28. This was seven full days before prices broke support
- The volume has been quite heavy over the past few days
NEXT: 2 Key Energy ETFs for Tracking This Trend
|pagebreak|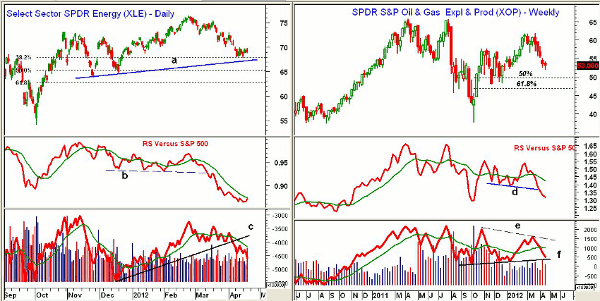
Click to Enlarge
The Select Sector SPDR - Energy (XLE) peaked in late February at $76.50 and is currently down 9.6% from the highs. Exxon Mobil Corporation (XOM) and Chevron Corporation (CVX) account for over 34% of this ETF.
- The 38.2% Fibonacci retracement support level at $68 has been tested over the past two weeks
- The chart has trend line support in the $67.20 area with the 50% support level just above $65
- Daily relative performance, or RS analysis, broke support, line b, in mid-March. The RS line is trying to turn up but is still below its weighted moving average (WMA)
- The uptrend in the daily OBV, line c, was broken on April 5. The OBV is well below its declining weighted moving average
- Weekly OBV (not shown) does look better, as it is still above its recent lows. A strong, high-volume rally would be needed to turn it around
- There is initial resistance at $71.50 and a daily close above $73 is needed to break the daily downtrend
The SPDR S&P Oil & Gas Exploration ETF (XOP) has also been under pressure for the past five weeks, and it is down 14.1% from the high at $65.81. The largest holding in this ETF only amounts to just a few percent of the fund’s holdings, so it is much more diversified than XLE.
- The 38.2% support level has been broken with the 50% Fibonacci retracement support level at $49.80
- XOP has major 61.8% retracement support at $46.85
- Relative performance still indicates that XOP is acting weaker than the S&P 500, as it has broken support (line d) and is below its weighted moving average
- Weekly OBV dropped below its weighted moving average three weeks ago and is now close to important support at line f
- There is near-term resistance at $54.50-$55.50 and then major resistance at $58
What It Means: The technical action indicates that crude oil and unleaded gas are likely to decline further, which should be a plus for the economy and consumers. The remaining question is whether the lower prices are also reflecting future economic weakness.
I would expect that energy stocks could bottom ahead of crude oil, and I will be watching the Select Sector SPDR - Energy (XLE) in the $65-$66 area, risking to a level below monthly chart support in the $62.80-$63.80 area.
Because it is more diversified, I favor the SPDR S&P Oil & Gas Exploration ETF (XOP) in the $50-$51 area, risking to under monthly support at $48.
There are no new buy recommendations at this time.


