
Looking at the charts of these blue-chip dividend payers pulls up a quartet of names that may be solid buys on the next significant pullback.
Even though the Dow Jones Industrials closed last week lower, the daily and weekly uptrend are still intact. The Industrials were up just 0.92% for August, while the Spyder Trust (SPY) tracking the broader S&P 500 was up 2.6%.
Several of the Dow stocks that were the strongest in the first two quarters of 2012 have had a rough summer, dropping sharply from their highs. This is likely to create new buying opportunities when the market undergoes its typical September correction.
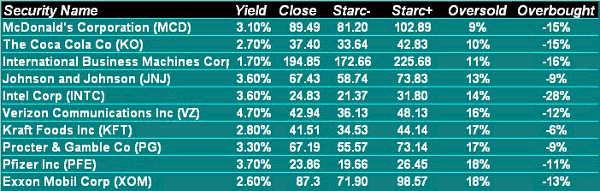
I use Starc band analysis to identify overbought and oversold conditions. When a market or equity is close to its upper monthly Starc band (Starc+), it is a high-risk time to buy and considered overbought. Conversely, when close to the lower monthly Starc band (Starc-), it is a low-risk time to buy and considered oversold.
Click
to Enlarge
The table above lists the ten most oversold Dow stocks based on the proximity to their monthly Starc- band as of the end of August. The first stock on the list is McDonald’s (MCD), which is 9% above its monthly Starc- band. As noted on the table, MCD currently yields 3.1%, and though it was the star performer in 2011—gaining over 30%—it is down 10.8% so far in 2012.
Given the market’s overall upward bias since the June lows, it is not surprising that none of the Dow stocks are closer to their monthly Starc- bands. Using monthly chart analysis, there are several stocks on the table that will be attractive new buy candidates on further weakness.
Click
to Enlarge
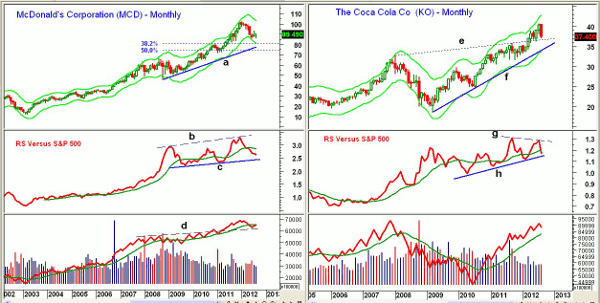
Chart Analysis: The monthly chart of McDonald’s (MCD) shows that it has dropped over 12% from the January 2012 highs of $102.22. The monthly Starc- band was tested in June, and currently sits at $81.20.
- There is initial support now in the $84.40 to $86 area, and then at $83.50.
- The major 38.2% Fibonacci retracement support from the 2008 low is at $80.79, with the monthly uptrend (line a) at $77.55.
- The relative performance or RS analysis confirmed the new highs in early 2012, but has since dropped below its WMA.The RS line has important support at line c, which needs to hold on a further correction.
- The weekly RS analysis (not shown) turned negative a few weeks after the highs, and is still below its declining WMA.
- The monthly OBV broke through major resistance (line d) in 2011, and is now trying to turn up from this support. The weekly OBV (not shown) is looking much more positive.
- There is first resistance at $90.40 with more important at $93.32.
Coca-Cola (KO) has reversed sharply from the early August highs of $40.66, as it lost 7.7% for the month. The monthly chart shows the breakout above the long-term resistance (line e), which is now in the $36.70 area.
- The monthly uptrend and the Starc- band are now at $33.64.
- The monthly relative performance did not confirm the August highs, as it has formed lower highs (line g), but does show a pattern of higher lows (line h).
- The weekly RS analysis (not shown) has dropped well below its WMA, as KO came close to its weekly Starc- band last week.
- The monthly on-balance volume (OBV) did make new highs in August, and is well above its rising WMA.
- Volume was heavy last week, so a further decline is likely over the next few weeks. A close above the resistance at $38.56 is needed to stabilize the short-term outlook.
Next: Verizon
|pagebreak|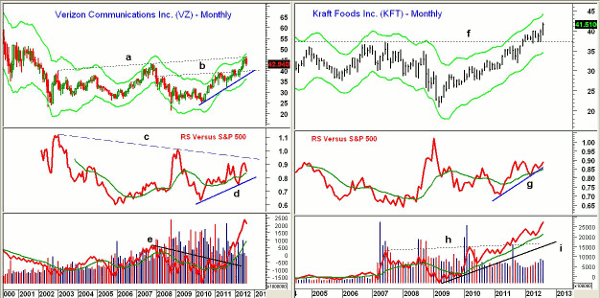
Click
to Enlarge
Verizon (VZ) also was weak in August, down 5%. This was after a dramatic run from the April low of $36.80 to the early August high of $46.41.
- The monthly chart shows that resistance going back to 2011 (line a) was tested in August.
- There is next support now at $41.80 (line b), and the 38.2% Fibonacci retracement support from the 2011 lows is at $41.06. The 50% retracement support is at $$39.39, while the monthly uptrend (line c) is in the $37.80 area.
- The monthly RS line has turned down and is still below its long-term downtrend (line c). It is still well above its uptrend (line d).
- The weekly RS line (not shown) did confirm the recent highs and looks more positive.
- The monthly OBV has turned down, but continues to act much stronger than prices. It is well above its rising WMA. The weekly OBV made new highs in August, and has just dropped below its WMA.
- The weekly chart has first strong resistance in the $44 to $44.50 area.
Kraft Foods (KFT) closed August up almost 5.4% for the month. The monthly chart shows the breakout above resistance (line f) at the end of 2011.
- The breakout level was retested several times over the past five months. KFT had a low of $36.75 in April.
- In 2002, KFT traded as high as $43.95, with the monthly Starc+ band now at $44.14.
- The monthly relative performance shows a solid uptrend (line g), and is above its rising WMA.
- The monthly OBV broke through long-term resistance (line h) in early 2011, and has been leading prices higher. The OBV has turned up from its WMA and confirmed the August highs.
- The weekly OBV (not shown) is also strong, and has confirmed the price action.
- There is first good support now in the $39.50 to $40.50 area, with major levels at $36.75 to $37.10.
What it Means: The strong close Friday improved the very-short-term outlook for the stock market. If the market moves higher early in the week, we could get new rally highs.
A break of last week’s lows will return the focus on the downside, and a correction is still likely in September. A correction should provide an opportunity to buy some of these high-yielding large-cap Dow stocks.
How to Profit: For McDonald’s (MCD), go 50% long at $84.88 and 50% long at $83.66, with a stop at $79.56 (risk of approx. 5.6%).
For Coca-Cola (KO), go 50% long at $35.32 and 50% long at $34.76, with a stop at $32.48 (risk of approx. 7.3%).
For Verizon (VZ), go 50% long at $41.22 and 50% long at $39.86, with a stop at $37.48 (risk of approx. 7.5%).
For Kraft Foods (KFT), go 50% long at $39.66 and 50% long at $38.56, with a stop at $36.44 (risk of approx. 6.8%).


