A close analysis of the Dow's performance in six of the past eight election years can give investors a better perspective on what they might expect this September, writes MoneyShow’s Tom Aspray.
It is always interesting to look for historical parallels in the stock market. Many have been hoping that the election year of 2012 would have some similarities with 1980. (Well, The Republican candidates were comparing President Obama to President Carter earlier in the week.)
In 1980, the Dow Industrials hit a low in April of 730 and then rallied to a high of 1,009 just after the election. This was a gain of 38.2%. A similar rally from the June 2012 lows of 12,035 would take the Dow to 16,632 and the Spyder Trust (SPY) to 175.70—wow!
I am not looking for that type of replay, despite Thursday’s impressive 244-point rally that has clearly turned the short-term momentum positive. Further gains are likely for the major averages, with the upper boundary of the trading channel for the S&P 500 now at 1,468. This allows for another 2.5% on the upside...but today’s jobs report is the wild card.
What I found more interesting in looking at September’s trading in the Dow Industrials during election years was the frequent high level of volatility. These historical charts, I think, will convince most investors that this is not a month to relax.
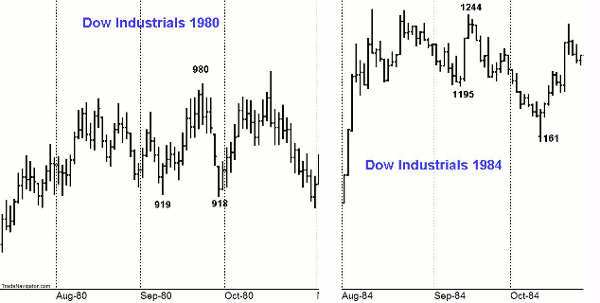
Chart Analysis: In September 1980, the Dow Industrials had several wide swings.
- Early in the month, the Dow made a low of 919, but then rallied 6.4% in just ten days.
- The next four days were not so pretty, as the Dow fell back to 918, giving up the 6.4% gain.
- Even though there was little change for the month, there was plenty of volatility.
- The broad trading range was resolved in November, as the Dow eventually breached the 1,000 level.
In September 1984, the Dow also developed a trading range, after it has surged from a July low of 1,082 to a high of 1,248 in the first part of August.
- The Dow dropped back to the lower boundary of its trading range at 1,195 on September 12, but two days later hit a high of 1,244.
- This Dow gain of 4.1% was quickly lost, as it was back below 1,200 on September 25.
- The selling picked up in October, as the Dow made a new correction low of 1,161.
- By Election Day, the Dow was back to the 1,244 level.
NEXT: The 1990s Were No Less Quiet
|pagebreak|I have not included 1988. The Dow bottomed in August of that year at 1,978, then had a steady climb to a late October high of 2,195, which was an 11% gain. But things were not so quiet in 1992.
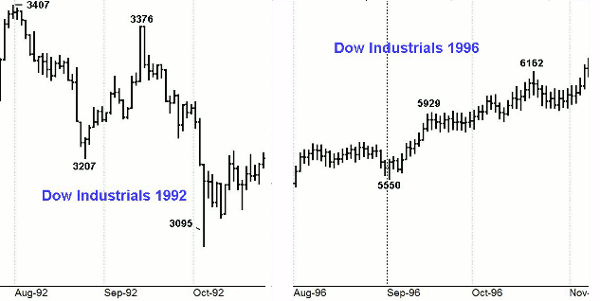
- In late July 1992, the Dow made a high of 3,407, but then dropped for most of August, reaching a short-term low of 3,207. This was a 5.9% decline.
- From the late August lows, the Dow moved sharply higher, reaching 3,376 on September 14. This was a gain of 5.2%
- But the Dow Industrials quickly reversed, making a low of 3,095 on October 5. This represented a drop of 8.3% from the mid-September highs.
The market in 1996 looked somewhat similar to 1988, but I decided to include it since the election resulted in a second term for President Clinton.
- The other reason I wanted to point it out was that in 1996, the Dow had traded in a 600-point range from March through September. The Dow broke out of this range on September 13, making new highs for the year.
- The Dow moved sideways for the next two weeks, but continued to move higher into Election Day.
- From the July low to Election Day, the Dow gained 17.5%.
- The Dow added another 7.3% by the end of November 1996.
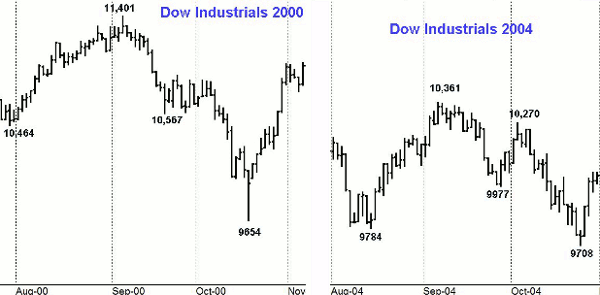
The election in 2000 was highly contested, and as most know it eventually was decided by the Supreme Court. The Dow dropped to a low of 10,464 in late July, but by early August it had surpassed the June-July highs and reached 11,401 on September 6.
- This was a gain of almost 9% from the July lows...but the euphoria did not last long. Just ten days later, the Dow was back to 10,567, which was a quick 7.3% decline.
- The Dow moved sideways for almost two weeks before the selling resumed in October, dropping the Dow to a low of 9,654. This represented a 15.3% drop from the early September highs.
Of course, 2004 was another second-term election year. After peaking in February, the Dow had formed a series of lower highs and lower lows.
- On August 13, the Dow made a new yearly low of 9,784.
- Just over three weeks later, on September 8, it was 5.9% higher, peaking at 10,361.
- Two weeks later, the Dow was back to 9,977 ( a 3.7% drop).
- The selling continued in October, driving the Dow to a late-month low of 9,708.
- From the early September highs to the October lows, the Dow declined 6.3%.
What it Means: The bulls clearly took over Thursday, and buying has continued early Friday. The short-term momentum is clearly positive, and it would take a drop equal to Thursday’s gain to reverse it.
The historical analysis of what the Dow Industrials did during past election-year Septembers sends a clear message that it is not a month to be either euphoric or complacent.
However, it is possible we may see the same type of steadily rising market that occurred in 1988 and 1996. I will be watching the first correction closely.
How to Profit: One of the best times to review your portfolio is when the market is strong. Therefore, take the time now to review each of your positions, identifying a stop level as well as an overall strategy.


