Bearish sentiment is high on these three stocks, although at least one is showing flashes of technical strength, which means contrarians should take notice, writes MoneyShow's Tom Aspray.
The cover story from the most recent Barron's discusses the results of their latest survey of big money managers. It reveals that only 44% are now bullish, which is down from 55% in the spring.
The number of bears has almost doubled since the spring, as they are looking for a decline in the S&P 500 to the 1,300 area. This would mean another 8% decline in the Spyder Trust (SPY) from current levels. Furthermore, only 41% expect that equities will be the best-performing sector over the next year.
The article contains a wealth of information about money managers views on the economy and the election, including which party they think will control the House and the Senate. I suggest you read the entire article.
From a contrarian standpoint, I found their list of most undervalued and overvalued stocks especially interesting, as the stock they disliked the most, Sears Holdings (SHLD), turned up in one of my buy scans over the weekend. Let's look at SHLD and two other stocks that are currently out of favor with the experts.
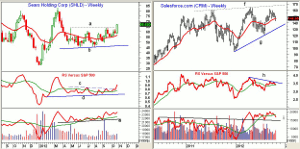
Chart Analysis: Sears Holdings (SHLD) was the most overvalued stock according to the money managers, as 88% gave it a thumbs down. This survey was likely completed before SHLD's close last week above the resistance at $63.70 (line a).
- SHLD traded as high as $82.90 in March, and hit a low of $44.66 in early June.
- The weekly chart has next resistance in the $69 to $73 area.
- The width of the trading range (lines a and b) has upside targets in the $80 to $83 area.
- The relative performance surged last week, which was picked up on my weekly scan, and it has broken through resistance (line c).
- The RS line is now well above its WMA
- The OBV has been acting stronger than prices since early September, when it moved above its WMA.
- There is initial support now at $63.70 (line a), with further levels at $60.80 to $62.
Salesforce.com (CRM) was considered overvalued by 72% of those surveyed. The company reports earnings on November 20. CRM peaked in April at $164.75, then formed a secondary high at $161.90 in the middle of September.
- CRM closed on the 20-week EMA, with the weekly uptrend (line g) at $131.40.
- The low in August was at $120.18, which is a key swing low that needs to hold on any further decline.
- The weekly relative performance is now testing its WMA. It needs to move through its downtrend (line h) to turn positive.
- The weekly on-balance volume (OBV) has dropped below its WMA, with strong support now at line i, which was the breakout level in early 2012.
- The daily OBV (not shown) is still below its declining WMA.
- There is initial resistance now at $150.35 and the declining 20-day EMA, with stronger levels at $155.67.
- The weekly resistance (line f) is now in the $167.40 area.
NEXT: A Status Update for Another Unloved Stock
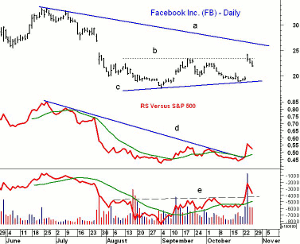
|pagebreak|The third most overvalued stock is Facebook (FB), as 80% gave it the thumbs down. I have avoided sharing my analysis of FB because of the limited trading history, though I did express my skepticism prior to the IPO.
- FB rallied last week on better than expected earnings, pushing the stock above the resistance in the $23 area (line b).
- There is further resistance in the $26.30 area (line a), and then in the $28 to $30 area.
- The daily relative performance has broken its downtrend, but it now needs to move above its prior peak to confirm a daily uptrend.
- Volume increased on the rally last week, as the OBV moved through resistance (line e).
- The OBV is well above its WMA, but will need to be watched on any further pullback.
- First support now sits at $20.48.
What it Means: The uniform negative view on these three stocks may be a contrary indicator, and it could mean they will be well supported if they decline further.
Of the three, only Sears Holdings (SHLD) looks attractive for aggressive investors on a retest of the breakout level. The chart suggests it may surprise the Street with a better than expected holiday season.
How to Profit: For Sears Holdings (SHLD), go 50% long at $63.16 and 50% at $61.64, with a stop at $57.90 (risk of approx. 7.2%). If the order is filled and the stock then moves above $69.20, raise the stop to $59.44.


