As central banks around the world have driven interest rates down to record levels, income investors have gotten squeezed but MoneyShow’s Tom Aspray has found a stock and two ETFS with attractive yields that have corrected from their recent highs.
As stocks continue to edge higher, those on the sidelines are trying to decide whether they should be buying, and if so what? Overnight news dampened some of the enthusiasm for the Chinese economy, but most realize their data is quite volatile.
Yields have picked up recently as the yield on the 10-Year T-Note closed last week at its highest level since April of 2012. Those who are very bullish on stocks at current levels think that a rotation from bonds to stocks could cause stocks to melt up.
In January’s articles When Will the Fat Lady Sing? and Don’t Buy the Junk, I discussed the uptick in rates and the key levels to watch, as well as recommending that investors not buy the popular junk bond ETFs. The bond ETFs peaked a week later and are trading well below their highs.
So what is an income investor to do? There is one US stock and two global ETFs that have pulled back from their highs and have attractive yields in today’s environment.
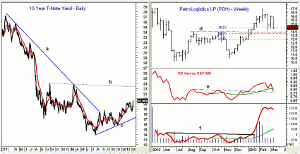
Chart Analysis: The daily chart of the 10-Year T-Note yield shows that the downtrend from the early 2011 highs, line a, was broken decisively last fall.
- The pullback in yields during November and December established a clear uptrend, line c.
- The current yield of 2.056% is in the next resistance zone at 2.06 -2.11%.
- The key trend line resistance, line b, is now at 2.28%.
- A weekly close above the 2012 highs at 2.363% and 2.407% would be a much stronger sign that rates had bottomed.
- A close in yields below 1.85% would be the first sign that the rally had lost upside momentum.
- There is more important yield support now at 1.715%.
PetroLogistics LP (PDH) is a $2.0 billion dollar diversified chemical company that has a yield of 7.7%.
- When PDH made its February high at $16.90, the yield was 6.60%.
- The low three weeks ago at $14.09 was between the 38.2% Fibonacci support at $14.47 and the 50% level at $13.70.
- In a last week’s trading lesson, I noted that retracements often drop to the midpoint between the 38.2% and 50% support levels.
- The August and October 2012 highs, line d, are at $13.94.
- The 61.8% level and the quarterly pivot are in the $12.94 to $12.91 area.
- The relative performance did confirm the recent highs but has dropped back below its WMA and is now close to support at line e.
- The weekly OBV was very strong on the early January breakout, line f, as the volume was quite high.
- Volume has been low on the recent correction, which is a positive sign.
- There is initial resistance at $15-$15.50.
NEXT PAGE: 2 ETFs with Nice Yields
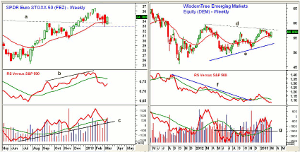
|pagebreak|SPDR Euro STOXX 50 (FEZ) is a blue chip Eurozone ETF that has over 30% in Germany and France. It currently yields 3.07% with an expense ratio of 0.29%.
- The two largest holdings are Sanofi (SNY) and Total SA (TOT), each of which make up over 5% of the ETF.
- FEZ had a weekly doji high of $36.52 at the start of February.
- The low two weeks ago was $32.82, which was a drop of 10% from the highs.
- The quarterly pivot is at $33.48 with the minor 61.8% support from the November low at $32.71.
- The weekly relative performance did confirm the highs in 2013, line b, before dropping below its WMA.
- The weekly on-balance volume (OBV) after testing its uptrend, line c, has moved back above its WMA.
- There is initial resistance now at $35.24 with the 127.2% Fibonacci target at $37.61.
The WisdomTree Emerging Markets Equity (DEM) has 200 stocks and yields 3.38% with an expense charge of 0.63%.
- DEM peaked at $58.09 in the first week of the year with a recent low of $54.80. This was a correction of 5.6%.
- The decline fell below the 38.2% Fibonacci support at $55.38 but held above the 50% support at $54.54, which is typical of retracements.
- The relative performance broke its downtrend, line f, but is now below its WMA and close to making new lows.
- The OBV completed its bottom in December when resistance at line g was overcome.
- The OBV has turned higher after testing its rising WMA.
- There is next resistance at $57.21.
What it Means: The corrections in both the SPDR Euro STOXX 50 (FEZ) and WisdomTree Emerging Markets Equity (DEM) do not appear to over. Therefore, I would look for a pullback into last week’s range to buy.
PetroLogistics LP (PDH) still could correct a bit more as the weekly momentum has not yet turned higher. All three look like good picks for the income part of your portfolio with PDH having the highest yield and the highest risk.
How to Profit: For PetroLogistics LP (PDH), go 50% long at $14.14 and 50% at $13.47, with a stop at 12.83 (risk of approx. 7%).
For SPSR Euro STOXX 50 (FEZ), go 50% long at $34.32 and 50% at $33.61, with a stop at $32.53 (risk of approx. 4%).
For WisdomTree Emerging Markets Equity (DEM), go 50% long at $56.46 and 50% at $56.02, with a stop at $53.96 (risk of approx. 4%).


