The big metal and mining giants have had a horrible 2013 and most show double-digit losses for the year. In a recent poll, even the industry leaders are not optimistic, so MoneyShow’s Tom Aspray takes a technical look for any signs that the worst might be over.
The stock market was able to shrug off the dismal report from Hewlett-Packard Co. (HPQ) and the three-hour shutdown at the Nasdaq to close with nice gains. If it wasn’t for the 12.5% drop in HPQ, the gains in the Dow would have been much more impressive.
The advancing stocks led the decliners by a 4 to 1 margin, which has stabilized the short-term outlook. A further bounce could take the Spyder Trust (SPY) back to the stronger resistance in the $167-$167.40 area. It is possible the gap from August 15 in the $167.44 to $168.70 area will be partially filled.
One of the most beaten-down industry groups this year has been the S&P Metals & Mining Index as despite its recent rally, it is still down over 17% for the year. The sentiment on these stocks from both investors and industry executives has been quite negative. At a recent June conference, 64% were reported to have a bearish outlook for the next six-12 months.
Plunging commodity prices have further pressured the big miners as they seriously overspent during the mining boom. For example, BHP Billiton Ltd. (BHP) spent $18 billion on new mines and refurbishing old ones. Their $5.5 billion in write-downs over the past two years has been offset by its strong earnings. Another mining giant, Rio Tinto Plc (RIO) took a $14 billion dollar hit on an investment in Canadian aluminum and African coal.
So does the technical outlook for the industry group or the big miners show any signs that the worst is over?
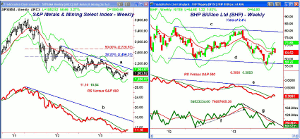
Chart Analysis: The S&P Metals & Mining Select Index shows a well-established downtrend going back to the early 2012 highs, line a.
- It has rallied 10% from its June lows but is still down over 17% for the YTD.
- This week’s close may be back above the 20-week EMA with the starc+ band at 1994.
- The downtrend is now at 2034 with the major 38.2% Fibonacci retracement resistance at 2456.
- The weekly relative performance is back above its WMA but still does not show a completed bottom formation.
- The major downtrend, line b, is still well above current levels.
- There is weekly support now in the 1700-1770 area.
BHP Billiton Ltd. (BHP) is a $171.9 billion global mining giant that recently reported a 30% fall in net profits and just announced a cut in executive pay. The stock is down just over 16% YTD.
- The weekly chart shows that the lower boundary of its two-year trading range, line b, at $56.82 was broken in early July as it hit a low of $55.66.
- The weekly starc+ band was reached last week with the high of $68.48.
- There is further resistance in the $70-$71 area with major (line a) in the $79.50-$80.50 area.
- The weekly relative performance is holding just barely above its WMA with major resistance at line e.
- The weekly OBV broke its uptrend, line f, in early March warning of the upcoming plunge.
- The OBV has failed so far to break its downtrend, line g, or move above its WMA.
- The daily OBV (not shown) is negative and does not yet suggest that a low is in place.
NEXT PAGE: What It Means
|pagebreak|Rio Tinto Plc (RIO) is an $87.6 billion London-based mining giant that is down over 15% in 2013. Their recent earnings reflected a 16% drop in profits.
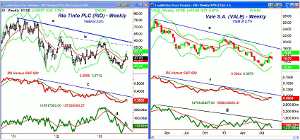
- From the June lows at $39.14, it has rallied to a high of $50.54 and is still up 21% from the lows.
- Once below the initial support at $45.50-$46, there is further at $43.72, which is the quarterly pivot.
- The relative performance has moved back above its MA but still shows a long-term downtrend, line c.
- The weekly OBV broke its downtrend two weeks ago and is still slightly above its WMA.
- The daily RS and OBV analysis (not shown) does suggest a short-term bottom may be in place.
- Once above the resistance at $50.54, the initial weekly downtrend, line b, is at $56.85.
- The longer-term downtrend, line a, is in the $59.50 area.
Vale S.A. (VALE) is a $77.4 billion Brazil-based miner that has rallied recently on the positive manufacturing data out of China. It is the weakest of the three as it is down over 26% YTD. According to Morningstar it has negative performance for the past three and five years.
- The rally from the low at $12.39 appears to have stalled below the $16 level.
- Additional resistance is in the $17-$17.40 area with the long-term downtrend, line 3, at $18.48.
- The weekly relative performance shows a similar pattern as the other two miners as it is just barely above its WMA.
- The OBV has dropped back below its WMA and is well below the resistance at line g.
- The daily OBV (not shown) has broken its downtrend and shows a much more positive formation.
- There is initial support now at $14.30-$14.00 with more important at $13.60.
What It Means: In the past few months, some of the investment firms have turned negative on many commodities based on concerns over growth and increased shipping cost. Other firms have concluded that the high level of bearish sentiment is a positive sign. My view that the economy will continue to improve has me keeping an eye on materials and these large mining stocks.
The lack of any strong weekly buy signals makes me cautious about buying any of these three miners near current levels as one would need to risk 7-10%, which is too high. The daily studies do need to be monitored closely as a drop back to more important support could create a buying opportunity.
How to Profit: No new recommendation


