On this Thanksgiving, MoneyShow’s Tom Aspray takes a break from focusing on monthly and weekly charts, and gives thanks for the plentiful levels of resistance and support that can be derived from yearly charts.
Though most of my analysis is focused on the monthly and weekly charts, the even longer term charts have less noise, which can reduce the number of false signals. This is one reason why I have found John Person’s quarterly pivot analysis so interesting.
As I pointed out in my recent workshop at the Las Vegas Trader’s Expo, the Spyder Trust (SPY) has stayed above its quarterly pivot all year. This is consistent with a positive major trend.
Several times a year, I also examine the yearly charts on some of the key markets, as I did last July. The yearly highs are often important levels of resistance, while the lows are often important levels of support.
The violation of the 2012 low for the SPDR Gold Trust (GLD) $148.53 in the middle of April was a strong sell signal. The low, so far, for the year has been $114.68. The 2012 low now becomes an important level of resistance.
According to the tech analysts at UBS, there are six large tech stocks that investors should own, in addition to top new trend names like; Facebook, Inc. (FB), Linkedin Corp (LNDK), Splunk Inc. (SPLK) and Salesforce.com Inc. (CRM).
A look at the yearly charts of their large tech picks can help us identify the key trends and the important levels to watch.
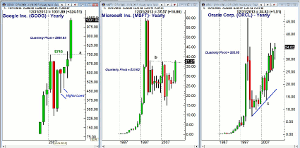
Chart Analysis: Google, Inc. (GOOG) is the first stock on their list, though it is up almost 22%, since the daily high close doji was triggered on October 10.
- This year’s wide range bar makes new yearly signals unlikely in 2014.
- However, the higher yearly lows in both 2010 and 2011 were bullish signs, as the stock was being supported at higher levels.
- It was supported by the move above the 2007 high, line a, in October 2012.
- The fourth quarter pivot is at $886.85 and it would take a close below it to weaken the trend.
The yearly chart of Microsoft Inc. (MSFT) shows that it has just moved above the 2007 and 2001 highs, line b, at $37.50.
- A yearly close above this level will be a further positive indication for 2014.
- The 15-year trading range is $22 wide, so there are yearly upside targets now at $49.50.
- There is first yearly support now in the $35-$37 area, with the quarterly pivot at $33.62.
- Major support now at $26.26 and $26.28, which are the lows from 2012 and 2013.
UBS also likes Oracle Corp. (ORCL), which has made higher yearly highs in three of the past five years.
- This year’s high at $36.43 is above last year’s high and just below the 2011 high of $36.50.
- The quarterly pivot is at $32.80 with more important support at $29.86, which are the year’s lows.
- Since the 2002 low, the year chart shows a clear uptrend, line c, that reflects long-term demand for the stock.
Next: 3 More Tech Giants to Watch
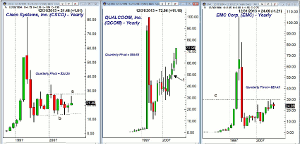
|pagebreak|One tech giant that has been frustrating investors for many years has been Cisco Systems, Inc. (CSCO).
- The yearly chart shows a trading range for the past six years.
- The quarterly pivot at $24.25 represents first important resistance.
- There is additional resistance at $27.72, (line c), which was the 2010 high.
- If it is overcome, it should signal a move to the 2007 high at $34.24.
- There is yearly closing support from 2011 at $19.65, and then at $18.08 from 2010.
- The 2011 low at $13.30 represents more important support.
The QUALCOOM, Inc. (QCOM) yearly chart looks quite positive since it bottomed after the dot.com low of $11.61 in 2002.
- In 2011, QCOM exceeded the 2008 high of $56.88, (point 1).
- The yearly close that year was the highest since 1999.
- Over the past three years, QCOM has made sharply higher lows.
- The quarterly pivot is at $65.63, with support at this year’s low of $59.02.
EMC Corp. (EMC) has traded in a tight range over the past three years.
- EMC has been trading below the quarterly pivot at $25.43 since early October.
- A weekly close above this level will turn the focus on the resistance at $30, line c, which was the 2012 high.
- The chart shows that EMC traded over $100 in 2000.
- There is yearly support from the past three years at $19.84 to $21.45.
What it Means: I can not stress too much the importance of longer term charts, as too many focus on the daily charts, not the weekly, monthly, or yearly charts.
The government shutdown in October appeared to trigger a fair amount of panic selling. At the time, I encouraged investors to Avoid the Noise, Watch the Numbers by looking at long-term support and resistance levels, as well as the quarterly pivots. This, I felt, could help them react to the short-term news.
The quarterly pivot table can be used to both guide stop placement, as well as to help to determine profit targets, as several of the ETFs stalled at their R1 resistance levels, before moving higher.
How To Profit: No new recommendation.


