By Drew Shaw of Lind-Waldock
The Moving Average Convergence/Divergence oscillator, or more commonly referred to by its acronym, “MACD,” is a well-known buy/sell indicator frequently used by technical analysts. Due to the popularity of this particular indicator among traders, I strongly suggest that you take a few minutes to understand its mechanics.
The MACD oscillates above and below zero. When above zero, the market is assumed to be in an upward trend, and vice versa. The crossing of zero does not indicate a buy or sell; it merely signals which way the market is trending.
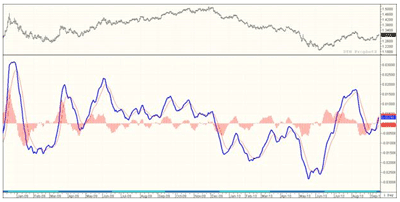
The MACD line is the thick blue line in Figure 1 and is calculated by subtracting a longer-term moving average from a shorter-term moving average. The moving average used is most commonly an exponential moving average, with the standard longer-term average being 26 periods and the shorter term 12 periods. Thus, if the shorter-term moving average is calculated to be 15 and the longer-term moving average is calculated to be ten, then the MACD will be five (shorter-term moving average minus longer-term moving average).
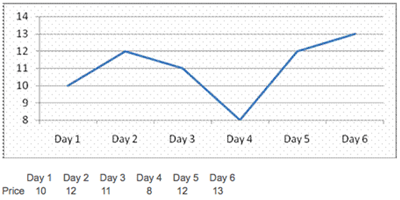
Now that you know how the MACD is calculated, it is easier to understand why zero is used as a benchmark for the market trend. If the shorter period has higher market prices than the longer period, on average, the MACD value will be greater than zero and the market will be trending higher. The opposite also holds true. Look at the simple example below if further clarification is required.
Shorter-term moving average = (Day 5 + Day 6)/2 days
= (12+13)/2
=12.5
Longer-term moving average = (Day 1 + Day 2 + Day 3 + Day 4 + Day 5 + Day 6)/6 days
= (10+12+11+8+12+13)/6
=11
MACD = Shorter-term moving average – Longer-term moving average
=12.5-11
=1.5 positive number as expected
Article Continues on Page 2
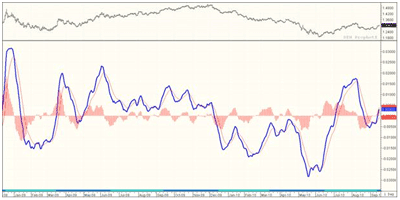
|pagebreak|The MACD indicator line is the thin red line in Figure 2 and is a moving average of the MACD line (blue line). The standard MACD indicator line is a nine-period exponential moving average.
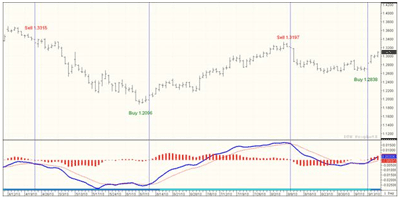
The are many different ways that analysts use the MACD oscillator, depending on market trend and personal preferences. I will explain to you the most common method, which is used in almost all standard software for buy and sell signals. A buy signal is created when the MACD indicator (red line) crosses the MACD (blue line) from the bottom. A sell signal is created when the MACD indicator (red line) crosses the MACD (blue line) from the top. See Figure 3 for examples.
The histogram displayed in Figures 1-3 is standard with most software packages. This histogram is nothing more than a visual aid for the user, indicating the difference between the MACD and the MACD indicator. Thus, if the histogram is positive, then the MACD is above or has a higher value than the MACD indicator.
If you have any questions about the MACD oscillator or would like to understand how this oscillator applies directly to futures trading, I encourage you to contact me.
By Drew Shaw of Lind-Waldock
Drew Shaw is a senior market strategist based in Lind-Waldock’s Toronto office and is serving clients in Canada. If you would like to learn more about futures trading, you can contact him at 877-840-5333, or via e-mail at dshaw@lind-waldock.com.
The data and comments provided above are for information purposes only and must not be construed as an indication or guarantee of any kind of what the future performance of the concerned markets will be. While the information in this publication cannot be guaranteed, it was obtained from sources believed to be reliable. Futures and forex trading involves a substantial risk of loss and is not suitable for all investors. Past performance is not indicative of future results. Please carefully consider your financial condition prior to making any investments. Not to be construed as solicitation.


