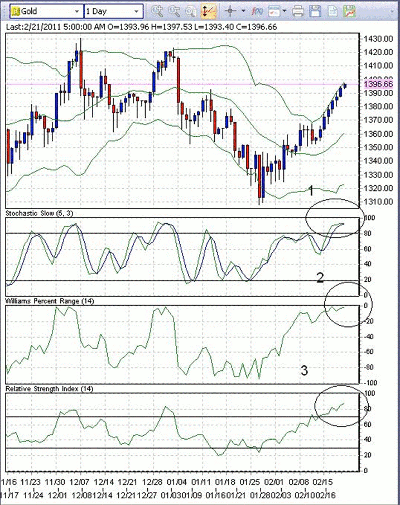
Some key technical measures are indicating that gold’s stunning upside rally may be due for a short-term correction.
Gold prices rose significantly in the last week and peaked at $1396.76 an ounce. Gold has made a significant upward correction, which can be directly correlated with the bullish trend of the EUR/USD cross.
However, the daily chart is suggesting that a recent upward trend is losing steam and a bearish correction is impending. This recent activity has raised the stakes for traders. From here on, the forex and commodity markets will see very high volatility indeed.
Below is the daily chart for gold by ForexYard.com. The technical indicators used are the slow Stochastic, Relative Strength Index (RSI), and Williams percent range.
- Point 1: The slow Stochastic indicates an impending bearish cross, signaling that the next move may be in a downward direction
- Point 2: The Williams percent range has peaked at the 0 marker and has turned bearish; this means that there may actually be a strong level of downward pressure
- Point 3: The RSI signals that the price of this pair currently floats in overbought territory, suggesting downward pressure
By Anton Eljwizat of ForexYard.com


