The NYSE TICK is a powerful market indicator, but to maximize its effectiveness, be sure to monitor four key areas and adapt your strategy accordingly.
The NYSE TICK indicator is commonly used to gauge the overall trend for NYSE stocks, but also other equity markets. It represents the number of stocks ticking up minus the number of stocks ticking down on the NYSE. For example, if the TICK reads +200, then 200 more stocks on the NYSE are ticking up then are ticking down. This is a bullish signal. If the TICK should read -354, then we understand that 354 more stocks are ticking down then are ticking up. This is a bearish signal.
If you’re an intraday user of the NYSE TICK— a powerful market internal—you must also account for current market volatility in your trading decisions. If you don’t, you’re likely to get in trouble.
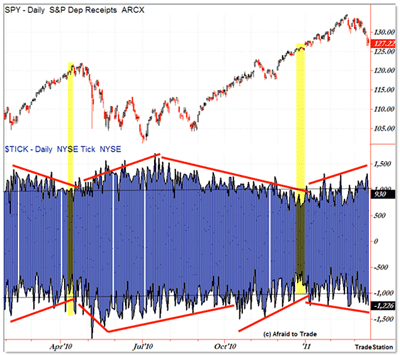
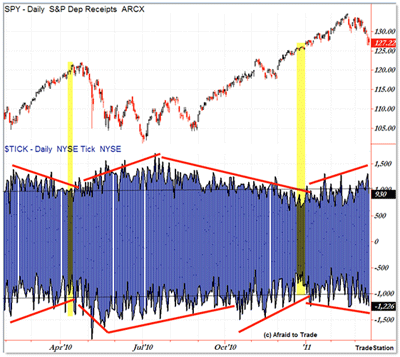
To show why, let’s take another look at the NYSE TICK and how it changes over time depending on the volatility of the current market:
What we’re seeing is SPY (or it just as easily could be the S&P 500) overlaid with the NYSE TICK ($TICK), which I frequently show in blog posts and you probably use in your intraday trading decisions.
Other than being a pretty picture (of waving blue), take a moment to look at how the TICK changes in terms of market volatility.
Stated differently, you’re far more likely to see higher TICK highs (intraday extremes) and lower TICK lows during volatile market periods than you are during less-volatile periods.
While this makes sense intuitively, it’s my guess that you’re probably not taking this into account in your trading decisions.
Example of Using NYSE TICK Indicator
Trader A loves to fade intraday TICK extremes that register plus or minus 1,000.
That means when the TICK registers -1,000, the trader will get long (SPY, @ES, or a leveraged ETF) or when the TICK registers 1,000, the trader will get short.
Thus, he (or she) is using the TICK as a contra indicator intraday to put on (or take off) positions.
That may be a logical strategy, but it does not take into account the fact that the TICK itself is volatile, and readings of 1,000 may mean more in non-volatile times and less in volatile times.
Alternatively, a trader might see no examples of the TICK registering 1,000 on the session during very-low-volatility periods.
How has the TICK changed over the last ten years? And is a reading of 1,000 as significant today as it was five or ten years ago?
These are questions you need to ask if you’re using the TICK in any capacity in terms of absolute values (such as “fade the TICK intraday when it hits 1,000″).
Let’s take a look at a simple comparison of TICK extreme highs and lows from 2000 to 2010 in terms of changes over time. You might be surprised.
Article Continues on Page 2
|pagebreak|Here’s the method: I imported NYSE TICK data from TradeStation into Excel and then ran a count function on intraday TICK highs and lows per year.
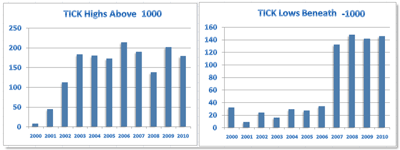
Here’s the quick data in bar chart format:
This bar chart answers the question, “How many intraday NYSE TICK highs exceeded 1,000, and how many TICK lows exceeded -1,000 on the session?”
Moving from left to right, we see that the TICK was far less volatile from 2000-2006 than it is presently.
What was eye-opening to me was that there were far more positive 1,000 TICK readings than negative 1,000 TICK readings across the entire spectrum, and that TICK lows under 1,000 spiked in 2007 and have remained elevated until the present day.
Despite the spike in TICK lows from 2007, it’s still only about 140 days (out of 250) per year that register TICK lows under 1,000. I did not expect the data to show that.
The TICK commonly hits intraday highs above 1,000—doing so around 175 of 250 days—but even that’s clearly not every single session.
This makes sense, in a way, in that during a bullish/rising session, the TICK tends to stay concentrated in the positive territory, and on a negative/falling session, TICK stays concentrated in the negative numbers.
So the quick takeaway is that the TICK has a bullish/positive bias.
The two exceptions where the number of TICK lows under 1,000 exceeded TICK highs above 1,000 were in 2008, when there were 147 TICK lows under 1,000 as compared with 137 TICK highs above 1,000, and in 2000, where lows hit 32 when compared to 8 TICK highs. I need not remind you that these were bearish years for the market.
A point of reference: An intraday session can record both an intraday high above 1,000 and an intraday low under 1,000.
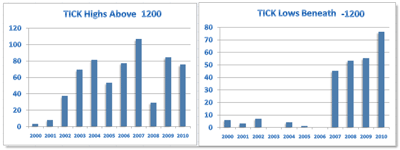
Interesting, so let’s take it one step beyond this and raise the TICK extreme threshold to 1,200 and -1,200:
The bar chart formations are similar, but the values on both counts are cut in half.
By raising the threshold to 1,200 for TICK extreme highs and -1,200 on TICK extreme lows, we see roughly half of the readings we saw when the parameters were 1,000 and -1,000.
In general, about 70 to 80 days record TICK highs above 1,200 while, over the last few years, about 50 sessions record TICK lows under 1,200.
The big observation that jumps off the chart at me is that, in general, TICK highs have been steadily decreasing, while TICK lows have been steadily increasing, picking up every single year since 2007.
Another interesting point is that there were zero TICK lows (according to the data) under 1,200 in the bullish years of 2003 and 2006.
If your strategy called for “buying when the TICK hit -1,200,” then you executed zero trades that year, which is why I wanted to conduct this study; to show changes in the absolute value of TICK extremes over the years and the need to adapt your strategies.
Article Continues on Page 3
|pagebreak|Going back to 2008, there were 53 TICK lows under 1,200 compared with 23 TICK highs above 1,200. The year 2000 saw six days with TICK lows under 1,200 compared with three days with TICK highs above 1,200.
You might also be surprised to learn that 2010 was another year where TICK lows under 1,200 outnumbered TICK highs above 1,200, but only by one instance (76 to 75).
The main takeaway for me is that—again—intraday TICK highs have steadily declined as intraday TICK lows have steadily increased over the last four years.
You need to know that if you’re trading with the TICK intraday.
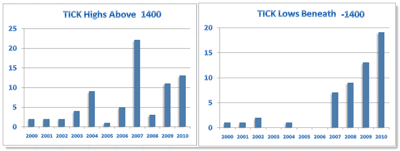
And finally, for fun, what were the results when I increased the intraday thresholds to 1,400?
Again, I was surprised at the steady increase in TICK lows under 1,400, rising each of the last four years.
It’s still a small number: Seven in 2007; nine in 2008 (surprising); 13 in 2009 (a super-bull year), and 19 in 2010 (a mixed bull year).
While there are a lot more insights you can gain from this data, I summarize with the following points:
- TICK extreme values change over time: A reading today is not what it once was years ago
- TICK low extremes have been steadily increasing over the last four years while TICK highs have been decreasing
- There is an inherent bullish bias in the NYSE TICK, which goes along with the natural bullish bias in stocks
- You must adapt your strategies to current realities in the TICK…not historical realities
There’s a bit of logic to this; markets change over time and so do major market indicators/internals.
Not only does the TICK change in volatile or non-volatile periods, it changes behavior from year to year (or at least over a period of a few years, like 2007 to present).
Look at the first chart again below. I drew a black horizontal line at the +1,000 and -1,000 TICK levels. Where you see white space (particularly at the end of 2010) means the TICK did not register a 1,000 reading for one or both sides of the market.
No TICK beyond 1,000 means no trades for the intraday fade trader. Oops!
What’s Worse Than a Day When Your Strategy Triggers No Trades?
How about a day where your strategy triggers a short with a TICK reading of -1,000, but then the TICK falls lower to -1,200, then -1,400. While price falls sharply with it, leaving you with a sudden, large loser as you got long the original -1,000 TICK reading.
Bigger oops!
Look, for example, at the May-July period in 2010, when daily TICK extremes of +1,500 and -1,500 were common. You’re in danger of blowing out a trading account if you deploy your + 1,000 or -1,000 TICK fading strategy in that type of environment.
So if you draw a permanent line in the sand with regard to the TICK, you risk the following pitfalls:
On one hand, you risk taking no trades (in a non-volatile environment), and on the other hand, you risk significant and serious losses/drawdowns if you try to fade the TICK too soon in a volatile period.
The quick conclusion is that you must take current stock market volatility into account and look at the TICK extremes relative to the very recent past; again, in context of what the broader market is doing (ranging tightly or exploding violently).
It’s best to adapt your TICK extremes to the current market environment instead of doing the same thing (triggering in/out at the same absolute level) at the same TICK level so that you don’t get into trouble when the TICK changes character, as it frequently does.
By Corey Rosenbloom, trader and blogger, AfraidToTrade.com

