I recently received a good question via e-mail which led to this article, clarifying one main tactic for trading (and forecasting) using the NYSE TICK indicator.
To review, the TICK can be used as a short-term indicator while daytrading.
Although it represents the number of stocks ticking up minus the number of stocks ticking down on the NYSE, it can be used as a barometer for stocks trading on all US exchanges.
For example, if the TICK reads +200, then 200 more stocks on the NYSE are ticking up then are ticking down, an obvious bullish signal.
If the TICK should read -354, then we understand that 354 more stocks are ticking down then are ticking up, an obvious bearish signal.
In addition to the actual "number" reading of the TICK, one should also pay attention to how the indicator is trading in relation to its support and resistance.
Read my earlier article, Secrets of the NYSE TICK Indicator, for more.
The question was along the lines of: “Price and TICK both made a new high today but the bullish signal failed because the market reversed.”
To which I thought,“No, I didn’t see that. I saw just the opposite: TICK worked just exactly as it should.
It’s a matter of perspective and context, so let’s take a quick fly-by of how to use TICK with price.
Generally, you want to see new TICK highs confirm (go with) new price highs. If so, that’s a confirmation, and thus we expect further higher prices yet to come. (So, a strategy would be to buy retracements in that context.)
Alternately, if you see price pushing up to new intraday highs or new relative highs, but TICK is lagging behind, registering lower spike highs, then that is a non-confirmation and you would look to protect profits and look to short any sort of price/trend line breakdown for a reversal play.
So while the original question is correct in the context of only that session, the trick is to pull back the perspective/camera to see what happened yesterday and compare the TICK (and price) today relative to what happened yesterday, or even in a broader context of the last few days.
NEXT: Case Study Using TICK on Recent Market Action
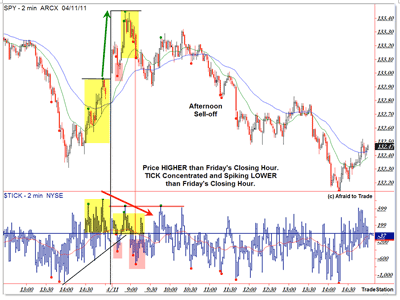
|pagebreak|Going into the close of Friday’s session, the SPY rallied up to the $133 key level and did so on the strongest TICK readings of the day—although it’s difficult to call TICK highs of 718 and 838 “strong” (those were the spike highs into the close):
Anyway, price did continue higher into the morning session on Monday, but as price rallied up to the $133.40 region, you can see two main points:
- TICK was spiking up to lower levels—the actual high of the day was met with a TICK high of 672. That’s not the picture of bullish domination
- While price was at new short-term swing highs (relative to the intraday chart), TICK was concentrated in the zero to 600 region (highlighted)
Neither of these points paints a picture of bullish confirmation. In fact, the signal is just the opposite: bullish weakness or bearish strength.
Price made one more go at retesting the highs, but TICK stayed under 700 (peaking at 681 on the session) and then the TICK swung quickly to a new intraday low at -842.
Which brings me to another important point (see the red highlights).
Notice that I drew a rising trend line at the close of Friday to indicate rising TICK lows.
That trend line broke that morning right out of the gate, and broke again on the way down from the $133.40 intraday high level.
So let’s take another look at this:
- TICK highs are not confirming the new morning price highs relative to the prior day’s rally into the close
- TICK lows are breaking a rising trend line and registering lower levels, though price is at new swing highs
Taken in conjunction, lower TICK highs and lower TICK lows, all while price is 40 cents above the rally into Friday’s close, paints a clearer picture of bearish strength/bullish weakness, which forecasts caution on the bullish side at best, and potential aggression or opportunities on the short/bear side.
And you can see the result of the session: New TICK lows expanding along with new price lows on the session, as the afternoon selloff forecast (but did not guarantee, of course) the morning TICK weakness with the new price strength.
By Corey Rosenbloom, trader and blogger, AfraidToTrade.com


