
Indicators like the RSI and others didn't protect traders from this week’s selloff, serving as a valuable reminder that indicators give only signals, not exact timing or price levels intended to guide trading.
On Monday, I woke up in Mammoth Cave, Kentucky and was preparing to drive to Stone Mountain, Georgia. We were in the central time zone and my kids were moving slowly after a long afternoon of Sunday spelunking. As my family was getting ready and we were packing the car, I adjusted stops and reviewed some open positions. Then we got in the car.
The market opened and I saw some early stability. Checking then near the end of the first hour of trading, I began to look through my Twitter feed. What I saw there reeked of outright panic, but the thing that struck me the hardest was seeing a message from someone I put in high regard suggesting that all indicators like the Relative Strength Index (RSI), Moving Average Convergence Divergence (MACD), and the McClellan Oscillator are useless and should not be used.
I almost pulled off the road I was so enraged! Why would anyone who has spent years planning and gaining knowledge from any trading system throw it away because of a market panic? I realize that emotions play a key role in trading and that over-exuberance can be magnified in a 140-character burst. But this really struck me as extreme.
Then I started thinking, what is the correct response to this? Maybe something smug like, “Perhaps I could teach you how to use these indicators.” That was not right. Something for the broad audience is more appropriate.
So what is the proper use of indicators? Below is a chart of the Spyder Trust (SPY). You can see that many indicators from last week were flashing oversold signals:
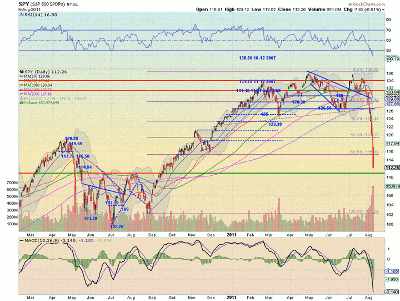
Click to Enlarge
Let’s focus on the Relative Strength Index (RSI). It was about 25 on Friday, and in the oversold territory. Many would look at that and expect a bounce higher. And that is the right thinking, but it does not indicate any timing of a bounce or that the bottom is in. It may still go lower.
Just because there are lines on the chart at 30 (oversold) and 70 (overbought) does not mean that price will reverse there, or near there, or anytime soon.
Take a look at a monthly chart of Netflix (NFLX) below as a good example. It remained in technically overbought territory since it first got there in October 2009—nearly two years ago!
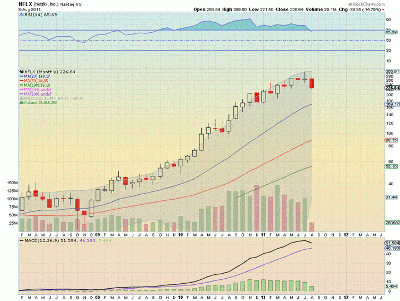
Click to Enlarge
But no indicator should be used on its own either. There were plenty of indicators on the SPY chart that signaled more downside.
And finally, these are indicators, not price itself. They were devised to give a clue as to turns in price, but are not the turn themselves.
Indicators should be used to raise your awareness, so you are ready when price decides it is the right time to turn. If you use indicators as a guide, then you will be prepared, but use them as a stop or entry and you are bound to be disappointed.
By Greg Harmon of Dragonfly Capital


