The charts for three of the biggest US bank stocks show decidedly bearish patterns, suggesting that the prospects for the already battered financial sector may soon get even worse.
There was a giddy euphoria on Tuesday about the broad market about almost getting back to last Thursday’s gap-down open on the Spyder Trust (SPY), but despite a 3.26% rise in the Select Sector SPDR - Financial (XLF), there are still many problems left in the financial sector, and three reasons come to mind very quickly: Bank of America (BAC), Goldman Sachs (GS), and JPMorgan Chase (JPM).
Now I can hear you saying that pointing out that BAC is in bad shape is old news, but in an effort to deflect some attention from Henry Blodget, I will include it here, and it gives a good example of what may still come.
These problems are a bit easier to see if you pull back and look at longer-term, monthly charts. Let’s start with BAC and then move on to the other “leaders” in the financial space like GS and JPM.
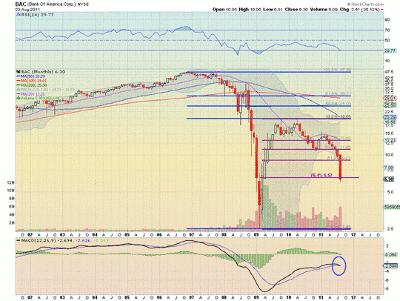
The chart for Bank of America (BAC) above shows some signs that it may rest or consolidate. The stock has just completed a measured move (MM) lower to the $6 area, down $9 like the move from April 2010 to November. In addition, it is out of the Bollinger bands and is near the 76.4% Fibonacci retracement at $6.52.
See video: Daytrading with Bollinger Bands
But this stall, if it happens, may be a good place to establish a short, with the move lower happening on increasing volume, and with a Relative Strength Index (RSI) that is still pointing lower and a Moving Average Convergence Divergence (MACD) indicator that is about to cross negative.
There is support lower at $5 and then $3.55 before the previous low at $2.51.
NEXT: Bearish Patterns for Goldman Sachs and JPMorgan Chase
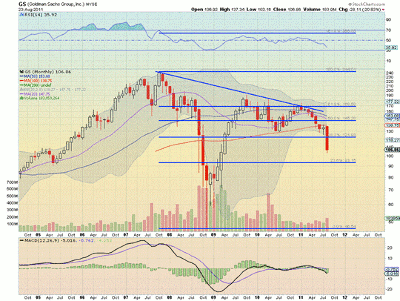
|pagebreak|Goldman Sachs (GS), the market “leader,” is also having a horrible August, as shown in the chart above. On the monthly time frame, it is also out of the Bollinger bands, but this chart looks even worse that that of BAC. It is below all of the simple moving averages (SMAs) and all are sloping down except for the 100-month SMA, the RSI is moving lower and the MACD is growing more negative.
This stock looks headed to the 23.6% Fibonacci retracement level at $93.15 after perhaps a pause in the $100-$106 range, which is resistance from 2005.
See related: Short Goldman Sachs with Low Risk
The other “leader,” JPMorgan Chase (JPM), has gone from great to gross in four months.
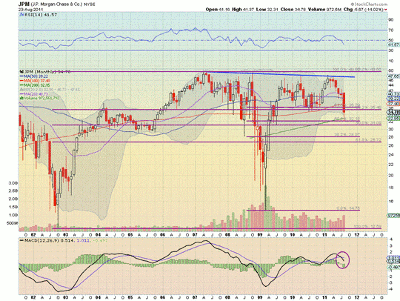
At the end of April, the stock was testing the neckline of an inverse head-and-shoulders pattern that if broken would yield a target over $82.50. Now it has negated that pattern with a move below the right shoulder bottom at $34.75 in August.
It looks to have some support between the 31.09 and 32.18 Fibonacci levels that it is currently testing, but it has clearly fallen below support at $35.50, which has been important many times prior.
The RSI is pointing lower and the MACD has just crossed negative, adding to the downside pressure. Support lower could come in the $26.72-$28.07 area and then at $23.
These are not bullish stories. You may be able to make a buck or two on short-term trades, but make no mistake: these charts suggest more bad news for financial stocks.
By Greg Harmon of Dragonfly Capital


