By using momentum indicators to spot divergences, traders can uncover early signals about changing trends in any market, says Candy Schaap of Investopedia.com.
Because trends are composed of a series of price swings, momentum plays a key role is assessing trend strength. As such, it is important to know when a trend is slowing down. Less momentum does not always lead to a reversal, but it does signal that something is changing, and that the trend may consolidate or reverse.
Price momentum refers to the direction and magnitude of price. Comparing price swings helps traders gain insight into price momentum. Here, we'll take a look at how to evaluate price momentum and show you what divergence in momentum can tell you about the direction of a trend.
Defining Price Momentum
The magnitude of price momentum is measured by the length of short-term price swings. The beginning and end of each swing is established by structural price pivots, which form swing highs and lows. Strong momentum is exhibited by a steep slope and a long price swing. Weak momentum is seen with a shallow slope and short price swing (see Figure 1 below).
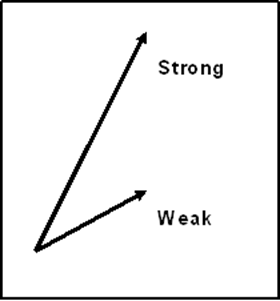
Figure 1
For example, the length of the upswings in an uptrend can be measured. Longer upswings suggest that the uptrend is showing increased momentum or getting stronger. Shorter upswings signify weakening momentum and trend strength. Equal-length upswings means the momentum remains the same.
Price swings are not always easy to evaluate with the naked eye; price can be choppy. Momentum indicators are commonly used to smooth out the price action and give a clearer picture. They allow the trader to compare the indicator swings to price swings, rather than having to compare price to price.
NEXT: Using Common Momentum Indicators
|pagebreak|Momentum Indicators
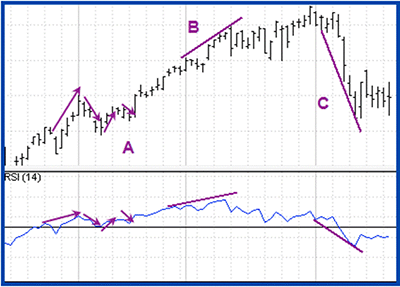
Common momentum indicators for measuring price movements include the Relative Strength Index (RSI), Stochastics, and rate of change (ROC). Figure 2 is an example of how RSI is used to measure momentum. The default setting for RSI is 14. RSI has fixed boundaries with values ranging from 0-100.
For each upswing in price, there is a similar upswing in RSI. When price swings down, RSI also swings down.
Figure 2: Indicator swings generally follow the direction of price swings (A). Trend lines can be drawn on swing highs (B) and swing lows (C) to compare the momentum between price and the indicator.
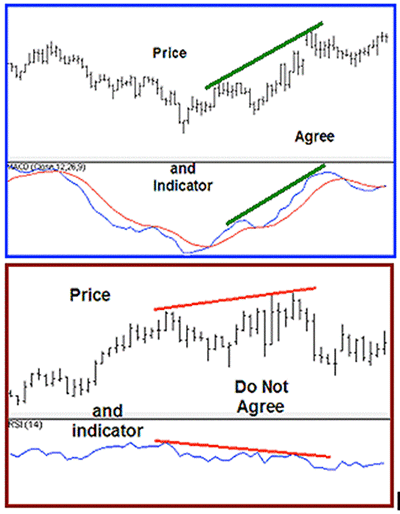
The study of momentum simply checks whether price and the indicator agree or disagree.
Figure 3: Compare price and indicator to make better trading decisions.
NEXT: Spotting Momentum Divergence; Implications for Traders
|pagebreak|Momentum Divergence
Disagreement between the indicator and price is called divergence and it can have significant implications for trade management. The amount of agreement/disagreement is relative, so there can be several different patterns that develop in the relationship between price and the indicator. For this article, the discussion will be limited to the basic forms of divergence.
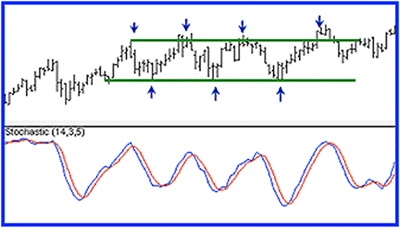
It is important to note that there must be price swings of sufficient strength to make momentum analysis valid. Therefore, momentum is useful in active trends, but it is not useful in range conditions in which price swings are limited and variable, as shown in Figure 4.
Figure 4: In range conditions the indicator does not add to what we see from price alone. Variable pivot highs and lows show range.
Divergence in an uptrend occurs when price makes a higher high, but the indicator does not make a higher high. In a downtrend, divergence occurs when price makes a lower low, but the indicator does not make a lower low. When divergence is spotted, there is a higher probability of a price retracement.
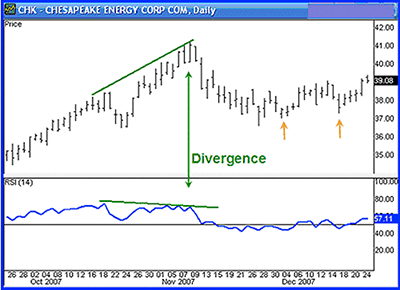
Figure 5 is an example of divergence and not a reversal, but a change of trend direction to sideways. It's from 2007 but is an excellent example of clear divergence.
Figure 5: Momentum divergence and a pullback. Higher pivot highs (small orange arrows) signal price support.
Divergence helps the trader recognize and react appropriately to a change in price action. It tells us something is changing and that the trader must make a decision about the trade, such as tighten the stop-loss or take profit. Seeing divergence increases profitability by alerting the trader to protect profits.
NEXT: Trade Example for an Energy Stock
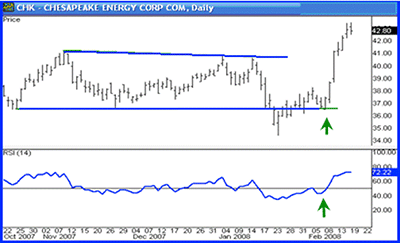
|pagebreak|Take note of the stock from a few years ago below in Figure 5, Chesapeake Energy Corp. (CHK), for which shares pulled back to the support.
The chart of CHK in Figure 6 (below) shows that trends do not reverse quickly or often. Therefore, we make the best profits when we understand trend momentum and use it for the right strategy at the right time.
Figure 6: Trend continuation. Agreement between price and the indicator give an entry (small green arrows).
Managing Divergence
Divergence is important for trade management. In Figure 5, taking profit or selling a call option were fine strategies. The divergence between the price and the indicator lead to a pullback and then the trend continued.
If you look at the pivot the price makes below the lower trend line, this is often referred to as a bear trap, where the false signal draws in shorts and then price quickly reverses. We can see that the signal to enter appeared when the higher low in price agreed with the higher low of the indicator in Figure 6 (small green arrows).
Divergence indicates that something is changing, but it does not mean the trend will reverse. It signals that the trader must consider an options strategy: holding, selling a covered call, tightening the stop, or taking partial profits.
The glamour of wanting to pick the top or bottom is more about ego than profits. To be consistently profitable is to pick the right strategy for what price is doing, not what we think price will do.
NEXT: See Wide-Ranging Impact of Market Divergences
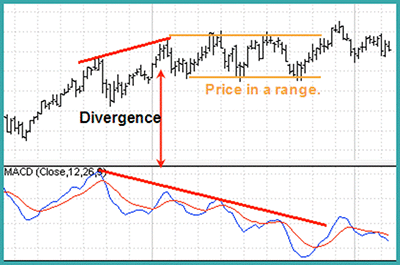
|pagebreak|Figure 7: Divergence results in range.
Figure 7 shows divergence that leads to sideways price action. Notice the weakening momentum in Moving Average Convergence Divergence (MACD) as price enters a range. This signals that the trader should consider an options strategy.
When price and the indicator are inconsistent relative to each other, we have disagreement or divergence. We are not in control of what price will do; we control only our own actions.
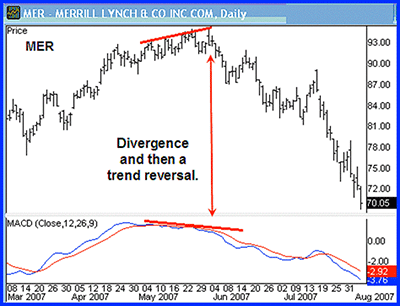
Figure 8: Divergence and then reversal of trend.
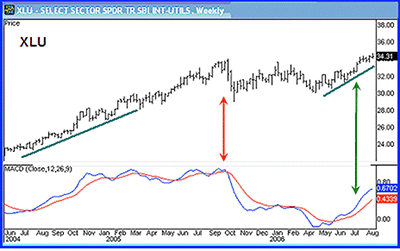
Sometimes divergence will lead to a trend reversal, as shown in Figure 8. The Select Sector SPDR Utilities (XLU) shown in Figure 9 pays a dividend and has options. Understanding trend momentum gives a profit edge, as there are three ways to profit here: capital gains, dividends, and call premium.
Though this chart is another from years prior, it still serves as a good example since it shows trend continuation after a sideways move, which translates into profit continuation.
Figure 9: Go with the trend when the price and the indicator agree.
Conclusion
The most useful way to use a momentum indicator is to know what strategy to use. Price will lead the way, but momentum can indicate a time to preserve profits. The skill of a professional trader lies in his or her ability to implement the correct strategy for price action.
By Candy Schaap, Contributor, Investopedia.com

