The problem really isn’t with candlesticks; it’s the use of them without the knowledge of the other technical analysis concepts needed, writes Greg Capra of Pristine Capital Holdings, Inc.
It was in the late 1980s that I became interested in the stock market. Computers were archaic compared to what is available today or even 15-20 years ago. There was no Internet, however, bulletin boards and data providers where you could get information over a phone line were becoming popular. It was the birth of online information and trading. Candlesticks where virtually unheard of and the opening price wasn’t available, but change was near.
The charting software I was using in those early days did have the ability to display price data in a candlestick format, but as I said the opening price was not available from the data provider yet. Eventually, that changed and I had to go through the process of downloading all the price data of the high, low, and close for about 500 stocks and indices again, but now with the opening price.
Saying it was a process must sound odd, since it’s possible to use most any charting software today and in the blink of an eye see any index, commodity, or stock you want. At the time, the download process took all night to get all the information I wanted over a phone line and a 2400 baud modem. This was followed by having to type DOS commands to transfer the data to the charting software files. Then the charts could be viewed. Nightly updates to the software database, which was resting on your computer’s hard drive (you better have a backup) took about and hour. It was truly the stone-age of online trading.
Now I had candlesticks charts! This was really going to help improve my ability to recognize turning points in the broader markets and stocks, or so I thought. As I delved into the understanding of candlesticks, I soon realized there was a problem. First, there were so many candlestick patterns with names that suggested that they were either bullish of bearish. If there are names to these candle patterns, didn’t it make sense that these names and the various combinations of candles should be learned and remembered? That seemed logical at the time, but the thought of remembering them all was overwhelming.
The next problem was that many times the candlestick or combination of candles did not result in a move in the direction of the pattern name. For example, a dark cloud cover, which is a bearish combination of candles, actually resulted in prices moving higher. Now, we all know that there is no sure thing in trading, but many of the so called candlestick experts suggest that these patterns have statistical odds of working. Lastly, and this one really added to problem/confusion, there could be a bearish candle pattern in one time frame and another time frame could be a bullish one! Indicators compounded the confusion! Been there?
What I soon learned was that candlestick patterns without the knowledge of other technical concepts make them random at best.
NEXT PAGE: 4 Tips to Better Candlestick Use
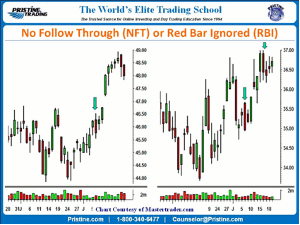
|pagebreak|Below are a couple of examples of bearish engulfing patterns that failed to follow through and there are other failures that aren’t marked. This type of no-follow-through (NFT) or red bar ignored (RBI) (green arrows) became a powerful part of my analysis (a green bar ignored (GBI) is just as powerful. When it comes to candlestick analysis, the message or signal that does not behave or follow through—as it is supposed to—is screaming to you what the big money is doing. Candles can speak to you—when you know the language.
This concept of NFT alone will make you more money than knowing candlestick pattern names ever will. When you see an NFT, it should point you to the direction that prices are most likely to move. And while the knowledge of the other concepts is necessary to high odds trading and investing, the NFT concept will guide you to what you should be thinking or should have checked.
Here is a checklist of some of what you need to follow with candlesticks:
- Bearish candlestick patterns have lower odds of follow through in a bull market and vice versa.
- The trend of prices must be taken into consideration and overweighed, rather than the candlestick pattern itself.
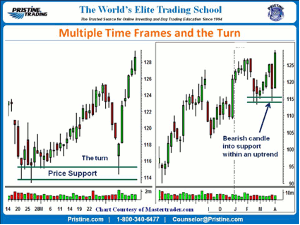
- The understanding of multiple time frame (MTF) analysis and combining them is essential to candlestick reversals following through as they suggest.
- Recognizing the amount of retracement between swing highs and lows alone will give you a better insight into the bearishness of a reversal or the lack thereof.
Remembering candlestick patterns isn’t needed and may actually have a negative effect on your trading. Here is why….
Turning points can happen in as many different ways as there are time frames to choose from and the different types of ways to view a chart. For example, there are daily, hour, 15-minute, 2-minute, 30-second charts, tick charts, range bar charts, volume bar charts, and many more. The different combinations are virtually endless, so can you imagine how changing time frames and types of charts can show a bullish candle pattern in one time frame and a bearish in another or vice versa? It can get crazy.
Welcome to the never-ending search for the Holy Grail, if you choose to enter it.
Prior levels of support (demand/buyers) and resistance (supply/sellers)—in combination with what I have mentioned - will increase the odds of a candlestick pattern actually working. However, realize that higher time frames compress data and the turn may not be seen in those higher time frames, which reinforces the reason why MTF is so essential to your success using candles.
Pristine Tip: the low of a bearish candle in a higher time frame is a turning point and a bullish candle or signal in a lower time frame that becomes a bullish candle in the higher time frame. Also, big money buyers don’t care how prices came down to support; only that prices are at support where they want to buy.
The problem really isn’t with candlesticks; it’s the use of them without the knowledge of the other technical analysis concepts needed and how to combine them to use candlesticks successfully.
I’m sure some, if not all, of what I experienced in my search to use candlesticks has been yours as well. This is because we all tend to follow the same path in the learning process of technical trading and investing. We also want to shorten that learning process and avoid losses caused by a lack of knowledge.
By Greg Capra, President & CEO, Pristine Capital Holdings, Inc.


