
Options expert Lawrence McMillan of McMillan Analysis Corporation goes to the charts to see how the stock market shot back up and points to exactly where and how volatility affected buy and sell signals throughout the week.
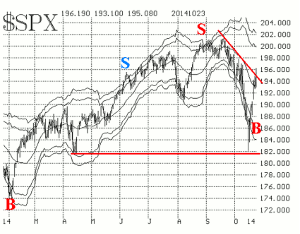
The stock market has rocketed back from a sharp selloff last week. At first, this appeared to be an oversold rally, but now it is picking up steam. Thus, it appears that it could be another intermediate-term bullish move, if one final thing falls into place: the (SPX) chart must clearly turn positive.
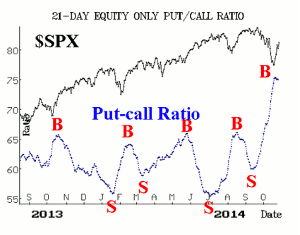
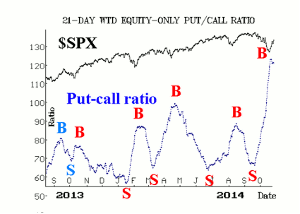
Meanwhile, equity-only put-call ratios rolled over to buy signals as of October 20th. From Figures 2 and 3, you can see that there was heavy put buying during the market's decline, and these ratios rose sharply to extremely high levels.
Market breadth had been weak all summer. Regardless, both breadth oscillators rolled over to buy signals a few days ago.
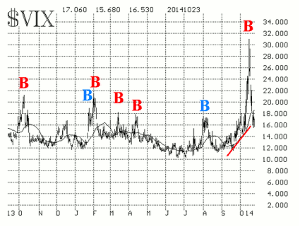
Volatility indices spiked up last week and then spiked down again this week. This created a powerful VIX spike peak buy signal.
In summary, the bullish evidence is piling up, but we need the SPX chart to confirm it in order to turn intermediate-term bullish.
Weekly Charts
S&P 500 (SPX), CBOE Market Volatility Index (VIX), 21-Day Equity Only Put Call Ratio (PC21), and Weighted 21-Day Equity Only Put Call Ratio (PC21 w) charts updated each Friday.
Click to Enlarge
Click to Enlarge
Click to Enlarge
Click to Enlarge
By Lawrence McMillan, Founder and President, McMillan Analysis Corporation


