This group has been a rare bright spot for the financial sector, but with the charts signaling a likely pullback, existing longs should book profits and future buyers can start looking for favorable entry points.
Within the financial sector, there have only been two places to put money to work, and one of them has been a group of payday lenders, Cash America International (CSH), EZCORP (EZPW), and First Cash Financial Services (FCFS).
These stocks are starting to show signs of tiring and a possible pullback, however. That’s a good sign if you have missed this run and are waiting for a pullback to get into these names, and it’s a warning sign to protect your gains if you are already in them. Let’s take a look at the important chart signals.
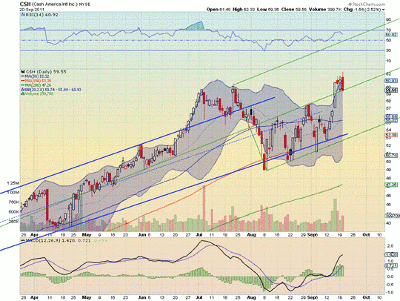
First up, Cash America Int’l, Inc. (CSH):
CSH has had a long uptrend followed by the pullback all stocks saw in early August. Off of that bottom, the Andrew’s Pitchfork has been a very good tool to use in trading the stock, as it bounces between the lower Median Line and Median Line.
See related: Case Study in Trading with Pitchforks
As it has crossed the Median Line, the stock is having difficulty moving away from it, and in doing so, it is creating an expanding top over the last few days. It also has the Relative Strength Index (RSI) rolling lower and the Moving Average Convergence Divergence (MACD) indicator starting to fade. Both support a move lower. Watch for a break of the Median Line for a pullback to begin.
NEXT: Similar Chart Pattern for EZCORP
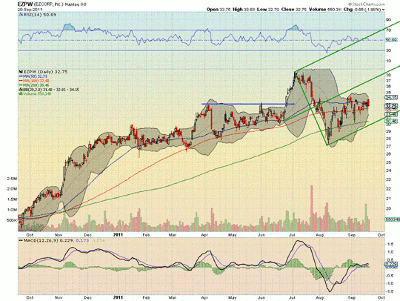
|pagebreak|Next up, EZCORP, Inc. (EZPW):
EZPW had the same pullback, but it has not risen quite as fast as CSH. It approached the Median Line of the pitchfork in early September but is now being attracted back to the lower Median Line. It also printed a bearish dark cloud cover candle pattern that signals a reversal if confirmed lower.
The RSI made it over 50 but never back into bullish territory over 60 and is struggling to hold 50 now, while the MACD is slowly falling back to the zero line. Finally the 50-day simple moving average (SMA) is rolling lower and about to cross down through the 100-day SMA. Look for a move below the 100-day SMA to confirm a pullback in motion.
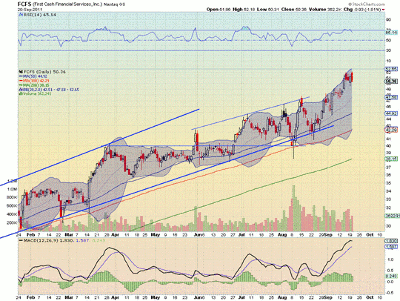
And finally, First Cash Financial Services (FCFS):
As you see, there’s no Andrew’s pitchfork here, but a simple expanding wedge top. There is a strong uptrend, but it is now more than 11% over the 50-day SMA. The RSI is starting to roll over and the MACD has started to move lower over the last four days. A break under 50 would confirm a pullback in motion.
By Greg Harmon of Dragonfly Capital


