

The stock market rally has cleared the way for a bond market selloff, and two popular Treasury bond funds are heading lower to test key Fibonacci levels. Here’s how traders can play them.
If you’re looking only at the stock market, you’re likely missing the other side of the coin, which is the bond market.
With the recent surge through resistance in stocks, let’s get a checkup on the break under support in popular bond funds like the iShares Barclays 20+ Year Treasury Bond Fund (TLT) and the iShares Barclays 7-10 Year Treasury Bond Fund (IEF).
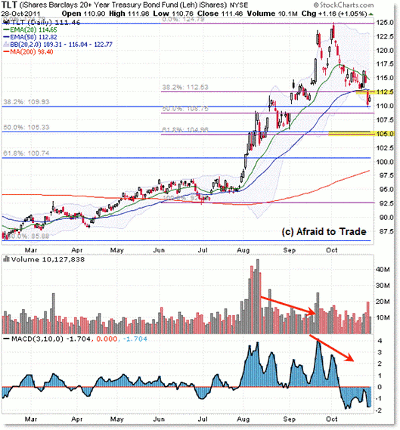
First, the 20+ year bond fund, TLT:
Click to Enlarge
Let’s start with the basics and move from there.
Bonds surged, breaking overhead resistance in August at the same time stocks collapsed. Bonds reached targets beyond what many traders thought was possible.
After such a strong rally, odds favor a retracement (at best) or even a reversal of trend, which was confirmed by the negative dual divergences in both volume and momentum (the picture is clearer in IEF below).
The TLT fund peaked at $125 and has been heading lower in conjunction with a “bottomed” stock market rocketing higher and higher.
The first sell signal came on the break of the rising 20-day exponential moving average (EMA) at $117.50, and the second signal triggered on Thursday with a breakdown and close under the rising 50-day EMA and 38.2% “short-term” Fibonacci grid.
That puts bonds on a downward path to test lower support levels, including the Fibonacci confluence here at $110 (bigger 38.2% level), and if this confluence target fails, we’d be looking to the middle confluence at $105.
Keep those levels in mind in the event we do continue to see lower and lower bond (fund) prices, which almost certainly will correspond with higher stock prices (particularly if the S&P 500 can close above 1,300).
NEXT: Latest Technical Picture for Bond Fund IEF
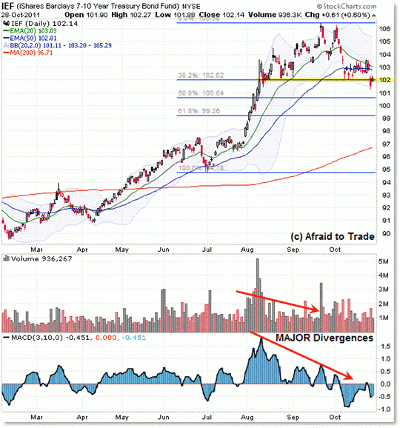
|pagebreak|As mentioned, the picture is similar in the 7-10 year bond fund, IEF:
Click to Enlarge
I believe the negative divergences show up clearer on the IEF fund, but you be the judge.
It’s a lesson on how divergences undercut (fail to confirm) new price highs, putting traders on the defensive (taking profits) or short selling in anticipation of a potential reversal (aggressive strategy).
Similarly, the first “confirmed” sell signal came on the break of the rising 20-day EMA at $104, which was followed up immediately with a break/close under the 50-day EMA (ahead of TLT).
Thursday gave us a fresh sell signal in the form of the breakdown under horizontal trend line support (price) and the 38.2% Fibonacci line, as drawn.
Longer term, $97 is a reasonable confluence target (price and the 200-day simple moving average, or SMA) if stocks continue their upward bounce (and of course, bonds continue their downward swing).
Continue watching these levels in conjunction with what’s happening in the stock market.
By Corey Rosenbloom, CMT, trader and blogger, AfraidtoTrade.com


