Ted Seifried of Zaner Group explains how price action in soybean futures can be played via options.
After seeing the updated USDA carryover numbers on last Friday's report, it occurred to me that we were not looking at the lowest soybean ending stocks numbers we have seen from the USDA in the last five years.
So, I had to do some digging back into old reports, which thankfully are kept on file by the USDA (our tax dollars at work). And there are some interesting comparisons that we can make to give us perspective on our current situation. A major note here though—our economy has been on a pretty wild rollercoaster ride in the last five years, and it would be foolish to not take that into account as well.
For this exercise, I am looking back at the September USDA reports. Note that these are not the final ending stocks numbers for the year. Here is what the projected US and World ending stocks numbers were:
- 2008/2009—US—110 million bushels / World—40.22 million metric tons
- 2009/2010—US—150 million bushels / World—62.85 million metric tons
- 2010/2011—US—225 million bushels / World—68.82 million metric tons
- 2011/2012—US—145 million bushels / World—51.94 million metric tons
- 2012/2013—US—115 million bushels / World—55.66 million metric tons
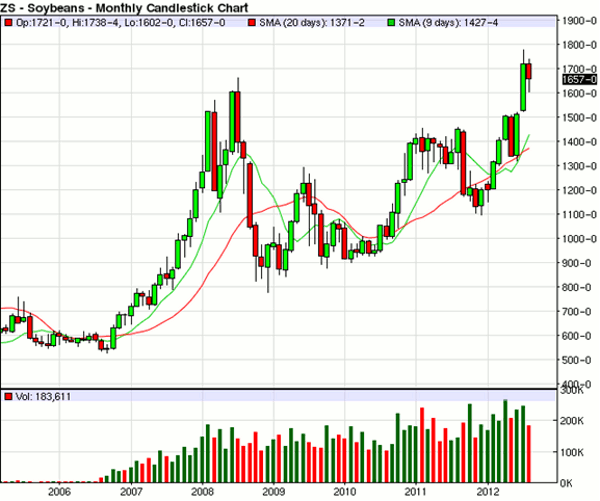
So as you can see, we were looking at a slightly tighter US and significantly tighter world carryover in 2008/2009. Leading up to September 2009, we saw soybeans rally to their previous highs of $16.63 placed back in July 2008, but by the time this report came out in September 2009, soybeans were back below $11.
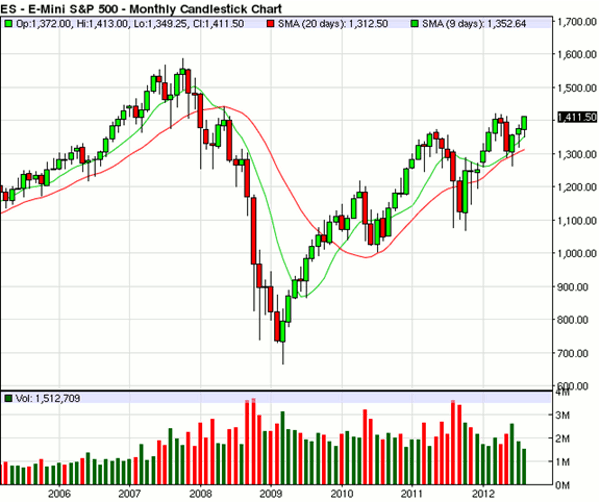
Now there was another significant change that happened in this time frame as well—the S&P 500 saw a precipitous drop starting in mid-2008. This sharp turn in the American economy certainly helped push grain prices lower than the balance sheet would have suggested at the time.
Fast forward to 2012. And according to the USDA, we find ourselves in a similar situation as 2008 as far as US stocks. However, the world outlook is not nearly as tight.
After five years, the S&P 500 is now inching back to pre-2008 crash levels. The fact that the S&P 500 is getting back to where we were five years ago is impressive to a degree, given the general weakness of the overall US economy, but it is very unimpressive considering the growth that we should expect over a five-year span. Overall the economy remains a concern, and consumers are much more cautious and price sensitive than in 2008.
Based on this data comparison, I feel that it's pretty safe to say that given the balance sheet the USDA is showing us—and given the current economic situation—that the numbers would suggest that we should see soybeans put in a high plus or minus 50 cents from the previous July 2008 highs (plus 50 cents based on limited inflation, minus 50 cents based on a more comfortable world carry over). So far, soybeans have bested the July 2008 high by $1.14.
Next: What will the USDA do?
|pagebreak|It very well may be the case that the USDA will have to lower average yield numbers or harvested acreage or both, so we could end up with a balance sheet much tighter than in 2008/2009. And even if the soybean numbers stay the same, and the corn balance sheet gets even tighter, then the beans could go along for the ride.
It also seems unlikely that we are set for a major stock-market crash again, mostly because we are not as strong as 2008 and there seems to be less of a bubble to burst.
However—yes there is a but, and it's a big one—if these are the lowest corn and soybean ending stocks numbers we are going to see from the USDA for this marketing year, and South America produces at least an average crop, we could see some pretty significant downside potential from where we stand currently.
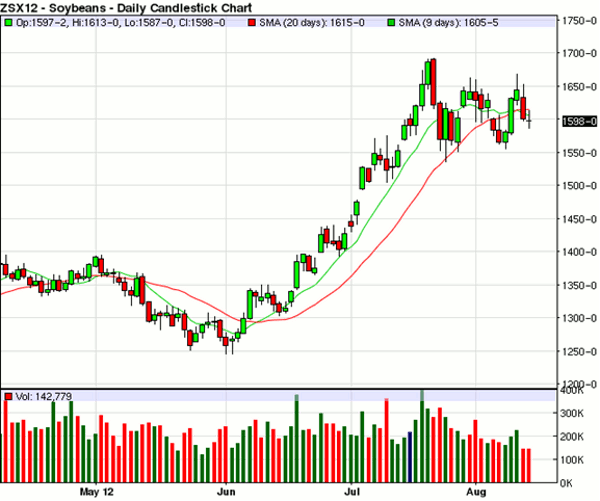
Look at the soybean continuation chart and see how much we have come off mid-summer highs in the past. Or just look at where November 2013 soybeans are currently trading.
With the recent beneficial rains for soybeans, and the potential for a massive South American crop with record acreage, I would be a little nervous about prices up here if I were a serious grain producer. Yes, SA could have another major drought year, and corn could pull beans higher, but these are big what-ifs that I prefer not to risk. I would much rather use an option strategy that leaves some room for upside potential yet gives me a floor at or near current prices.
(For more basic strategy information, read CME Options On Futures: The Basics.)
Next: Continuous S+P 500 Index Monthly chart
|pagebreak|Continuous S+P 500 Index Monthly chart:
All this means that speculators should be looking for opportunities, and producers need to look to lock up some prices while we have new crop corn near $8 and new crop soybeans near $16. Give me a call for some ideas. In particular, producers looking to hedge all or a portion of their production may be rather interested in some of the strategies that I am currently using.
In my mind, there has to be a balance. Neither technical nor fundamental analysis alone is enough to be consistent.
Ted Seifried can be reached at (312) 277-0113 or tseifried@zaner.com, or check out his blog at: http://tedseifriedfutures.com/. Futures, options and forex trading is speculative in nature and involves substantial risk of loss. This commentary should be conveyed as a solicitation for entry into derivatives transactions. All known news and events have already been factored into the price of the underlying commodities discussed. The limited risk characteristic of options refers to long options only; and refers to the amount of the loss, which is defined as premium paid on the option(s) plus commissions.


