With news of the Twitter IPO breaking last week, the staff at bespokeinvest.com took a look at how IPOs, in general, have done so far in 2013.
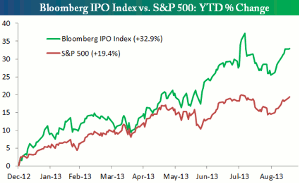
The Bloomberg IPO Index is made up of all companies with market caps >$50 million that have gone public over the last year. As shown in the chart below, the IPO index is up 32.9% YTD compared to a gain of 19.4% for the S&P 500 (SPX) (SPY). This represents pretty significant outperformance for IPOs in 2013.
IPO Index vs. S&P 500
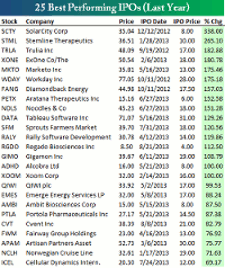
Below is a table highlighting the 25 best performing stocks in the Bloomberg IPO Index since going public. As shown, Solar City (SCTY) is up the most with a gain of 338%, followed by Stemline Therapeutics (STML), Trulia (TRLA), ExOne (XONE), and Marketo (MKTO).
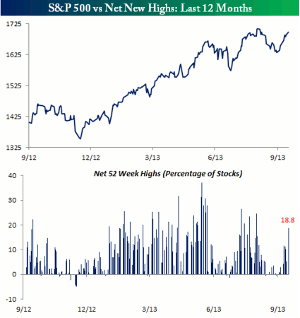
Highest Number of New Highs Since August 1
Earlier this week, as the S&P 500 saw its intraday all-time high, the number of stocks in the S&P 500 that traded to 52-week highs reached 94, or 18.8% of the index. This represents the highest amount of new highs in a single day since August 1.
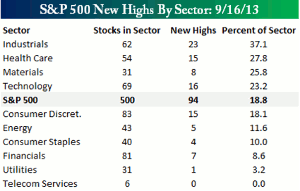
The table below breaks out the number of new highs in the S&P 500 by sector. On both an absolute and a percentage basis, the Industrials (XLI) sector saw the greatest number of new highs (23), which worked out to 37.1% of the stocks in the sector. Other sectors where a large percentage of stocks hit 52-week highs were Health Care (XLV) (27.8%) and Materials (IYM) (25.8%).
With the market firmly in positive territory, it was defensive sectors like Telecom Services (XTL) (0.0%) and Utilities (XLU) (3.2%) that saw the smallest percentage of new highs.
By the Staff of bespokeinvest.com


