

Don Kaufman, founder of TheoTrade, asserts that spending cuts are healthy, but when the economy is growing at less than 2% and is addicted to debt, cutting off the deficit spending will push it over the edge.
In this article, I will discuss why the economy needs a massive deleveraging from debt both on the corporate and government side. This will raise the velocity of money in the economy. The velocity of money is the rate at which money is spent over a period. This low money velocity is why the Fed’s balance sheet expansion hasn’t created inflation. While the Fed’s QE hasn’t caused inflation, it has caused bubbles in financial assets.
Ever since the velocity of money peaked in 1997, there have been three stock market bubbles. The falling velocity of money also preceded the 1929 stock market crash. I will also tie in the latest CBO deficit projections to my discussion. It’s a shock to no one who follows government spending that the projections are dire.
The economy is about to complete the multi-decade super cycle. The first cycle in the chart below started when the velocity of money peaked at 2.0 in 1918. From 1918 to 1929 the economy entered its bubble stage as the velocity of money declined to about 1.25 in the early 1930s. The velocity of money bottomed and started moving higher due to the massive deleveraging caused by the Great Depression. Following this cycle, there was a mini cycle caused by the increase in deficit spending to fight World War II. After the war ended, the economy deleveraged again.
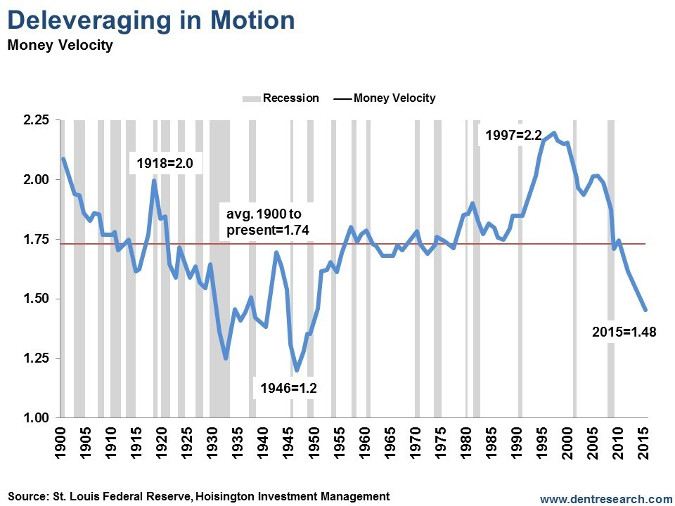
The latest cycle started in 1997 when the velocity of money peaked at 2.2. Since then the velocity of has been in decline. The previous two recessions didn’t spur a deleveraging. The next recession will likely be the one which marks the end of the super cycle like what happened during the Great Depression and the period after World War II. The chart above isn’t updated with the latest data, but I used it because the FRED website only has data which goes back to the 1950s. The Q4 M2 velocity of money was 1.437. That’s about .17 point above the bottom in the early 1930s.
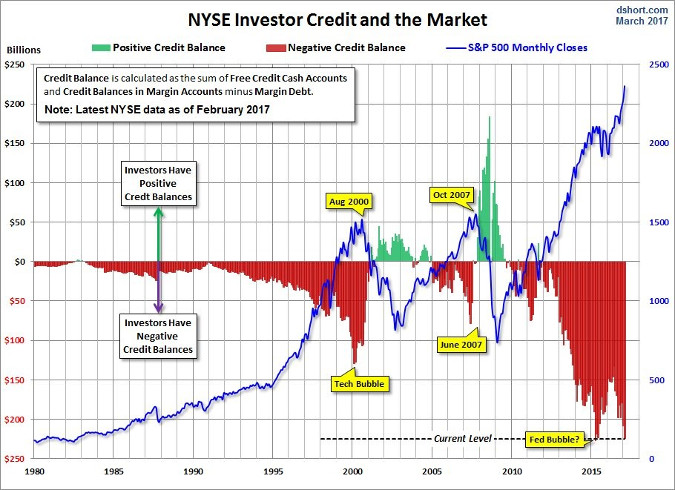
The Federal Reserve has been patching up recessions with lower rates and QE instead of allowing for a real deleveraging to occur. The combination of falling money velocity and the Federal Reserve’s easy money policy has led to the chart below. As you can see, investors have almost always had extremely negative credit balances since 1997 when the velocity of money peaked. The negative credit balance has occurred because margin debt is higher than credit balances in margin accounts plus the money in free credit cash accounts. The margin debt is higher in this bubble than the 1990s bubble as almost every sector is in a huge bubble compared to it largely being constrained to tech in the 1990s.
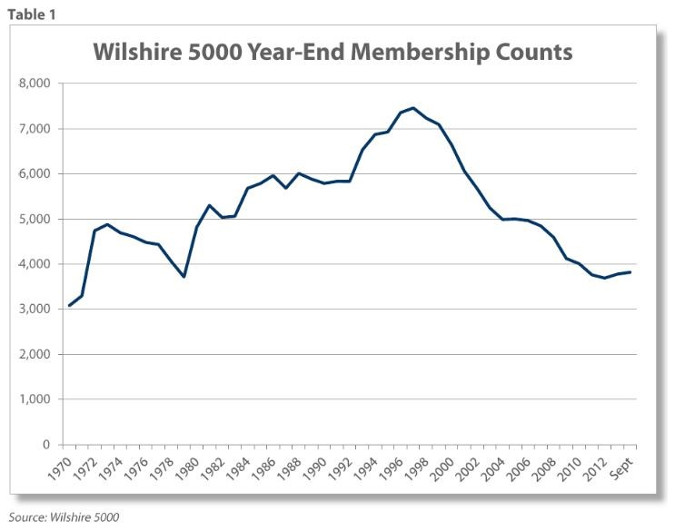
The decline in the velocity of money happened right before the peak in the number of stocks in the Wilshire 5000. On July 31, 1998, the number of stocks in the Wilshire 5000 peaked at 7,562. Since then, the number of stocks has been in decline as there is now under 4,000 stocks in the index. The amount of fixed investment in the economy has declined as it has been replaced by acquisitions and buybacks. This increases stock indices, but does little to create value in the economy.
Because there was no deleveraging and increase in the velocity of money, firms have not learned the lesson of the last cycle as they’re buying back stocks near the peak of the market again. It shows how weak the economy is that that many of the best performing stocks are not ones with fast revenue growth, but ones which have the biggest buybacks. Firms know demand is weak for their products, so they don’t invest in new initiatives. Instead they try to cut costs. The innovation speed and productivity growth have declined.
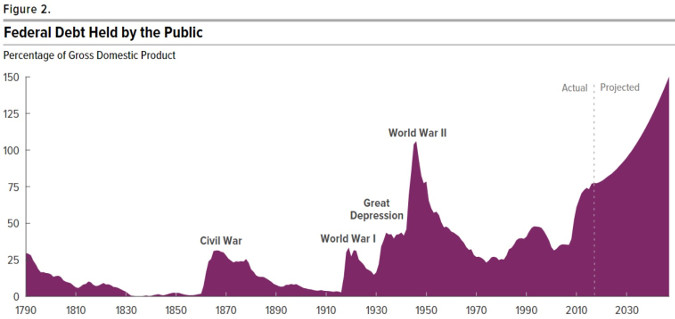
As I mentioned, the CBO recently released its latest projections on taxes and spending. The chart below shows the historical debt as a percentage of GDP. The chart shows the point earlier when I commented that the debt became too high during World War II which lowered the velocity of money. Then the deleveraging occurred and allowed the economy to heal. The current situation is a combination of the first two super cycles as the speculation in stocks has almost reached the level of 1929 (Shiller PE) and the debt to GDP is almost as high as the World War II peak. The current projections are for it to get higher than the World War II peak in a couple of decades.
Personally, I don’t think the situation will play out the way the CBO projects. Because the velocity of money will eventually bottom out as the economy deleverages and the financial bubbles pop, the deficit will start to grow at a quicker pace than what occurred in the 2008 recession. The popping of the financial bubble will lead to a government debt problem which will need to be resolved as it gets out of hand. At that point, either the dollar will be devalued or spending will need to be cut drastically.
The CBO is trying to use these projections as a warning sign for Congress to cut spending, but instead the government is focusing on tax cuts. If the government decided to cut spending to prevent a budget crisis after the financial bubbles pop, it would likely provoke a recession. Spending cuts are healthy, but when the economy is growing at less than 2% and is addicted to debt, cutting off the deficit spending will push it over the edge.
Conclusion
The next recession will be the worst since the Great Depression because there will be a deleveraging finally. It has been overdue because of the Fed preventing economic healing from occurring during recessions. In each business cycle, the debt has gotten larger and the velocity of money has fallen. These trends will soon reverse as the Shiller PE is near what it was in 1929, the velocity of money is near the lows of the 1930s, and the debt to GDP is near the World War II high.


