In his weekly report, Don Kaufman, founder of TheoTrade, explains what the latest economic reports mean, the impact of the French election Sunday with Macron and Le Pen and he analyzes oil prices, OPEC, rig counts and shale production.
My commentary today will be in three parts. The first part will be about the latest economic reports. The second part will be about the French elections. The third part will be about the latest movements in the oil market.
Philly Fed Decelerates
The Philly Fed’s Manufacturing Business Outlook survey was released April 20. This is an example of a soft economic report which was showing a high level of optimism earlier in the year. The deceleration this survey showed on a sequential basis is part of a new trend I forecast occurring as businesses grapple with the reality that the economy is very weak and fiscal policy will not have an impact on the economy until 2018.
The New York Fed’s Nowcast uses soft data to come up with its projections. It is expecting 2.7% growth in Q1 and 2.1% growth in Q2. Although the estimates are off base, I’m inferring from the decelerated sequential growth that some of the surveys will miss expectations in the future. The main reason I have this opinion is because soft data rarely stays this optimistic for long. Even if I expected the economy to improve, I’d still expect deceleration in the soft data.
Delving into the specifics of the Philly Fed report, the headline diffusion index fell from 32.8 in March to 22.0 as you can see in the chart below. It’s still positive, so calling it a bad report would be wrong. However, going from ‘great’ to ‘good’ is a problem for investors as they are always trying to price in future events. As you can see, the report earlier this year was the best in this cycle. The recent sharp down draft is more violent than the one which preceded the 2014-2015 manufacturing recession.
Breaking down the report, it shows that employment growth is healthy, capital expenditures spending is healthy, and inflation pressure waned. As you can see from the chart below, even though the headline index fell, the employment indices improved. The current employment index improved 2.4 points and the employment forecast index increased 0.9 point. The average workweek index was unchanged at 18.9. This positivity in the labor market is consistent with most other measures of the labor market.
In the report, 52% of businesses said they’d increase capital expenditures in 2017 and 17% said they would decrease them. And 63% of firms said most capital spending would occur in the second half of the year. This signals that businesses are forecasting fiscal policy to boost the economy later in the year. They will be disappointed because the positive effects of fiscal policies will be pushed back to 2018 caused by legislative delays.
The prices paid index fell from 40.7 to 33.7 and the prices received index fell from 20.6 to 16.6. This follows along with the recent deceleration in core CPI growth and the decline in the ten-year bond yield. The Trump-flation has faded. The only question is why the Fed is raising rates in such an environment.
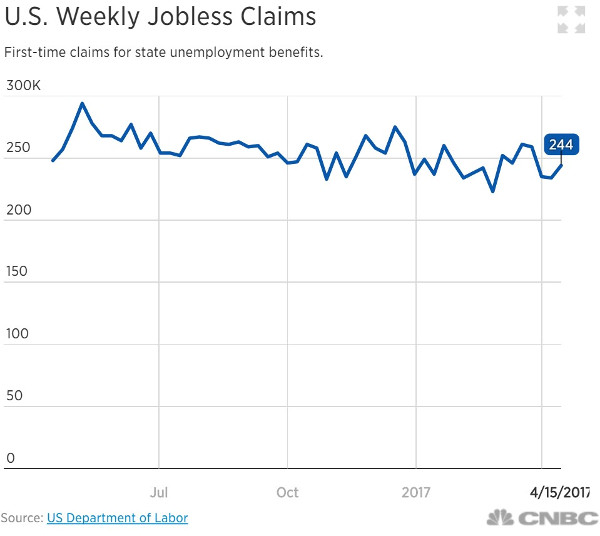
The jobless claims report reinforces the strength in the labor market shown by the Philly Fed. As you can see in the chart below, the jobless claims remained in its recent range as it’s now at 244,000. The same odd scenario is persisting where the non-farm payrolls, ADP, and jobless claims all show a strong labor market, but hourly earnings growth fails to beat inflation. The weak hourly earnings growth also makes Fed rate hikes seem like a mistake.
To recap my position, I think the Fed should raise rates to correct pass mistakes. However, if I were to make my decision solely on the strength of the economy, I’d consider cutting them, since it’s so weak.
French Elections
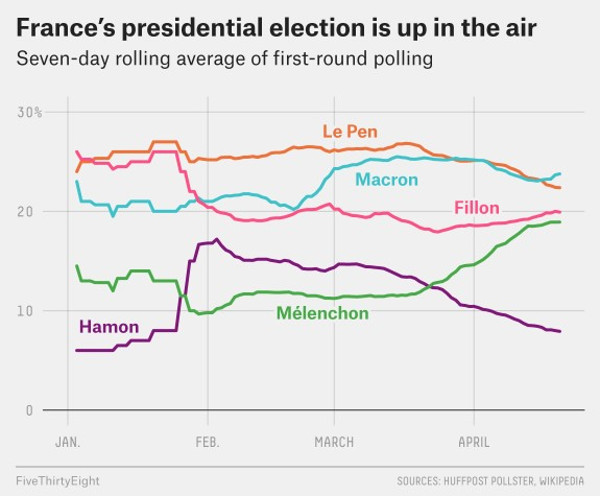
Since the last time I discussed the French presidential election, the polls have tightened considerably. You would think that predicting who will win would be difficult given that the polls are showing nearly a four-way tie. However, it’s clear who will win because of the quirky way the election works. As a reminder, the top two finishers in the first round on April 23 make it to the second round on May 7. Macron leads the first round of voting by a couple points and trounces his opponents by at least 15 points in the second round. Therefore, he simply needs to make it to the top 2 in the first round for a high likelihood win in the second round. (Macron drew 24% of the April 23 vote, followed by Marine Le Pen with 21.3%.) If Macron wins, like the polls suggest, it would be bullish for the market because he is a former investment banker and considered to be somewhat of a centrist.
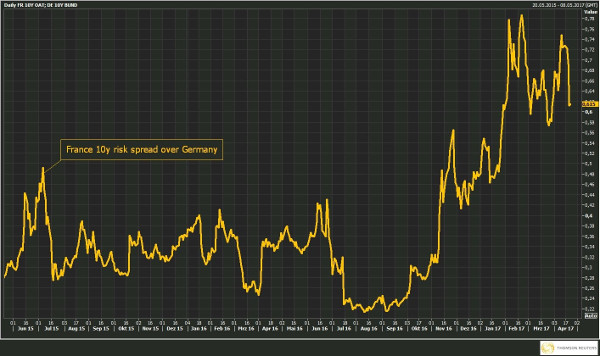
The chart seems to support by expectation. It shows the difference between the French ten-year bond yield and the German ten-year bond yield. This is considered the political risk spread as Germany is one of the most economically stable countries in the E.U. As you can see, the spread has tightened recently as the risk of a win by Le Pen or Melenchon seems unlikely.
Oil Market
Oil fell 6.7% for the week as it closed on Friday at $49.62. The reason why oil fell was because there are concerns about whether OPEC and Russia will extend their cuts. It’s mostly rumor mongering until the decision is made on May 25. What’s not a rumor is the quick speed the US rig count has recovered with. This is the sore spot for OPEC because if it doesn’t cut production, prices will fall and if it does cut production, US shale will gain market share.
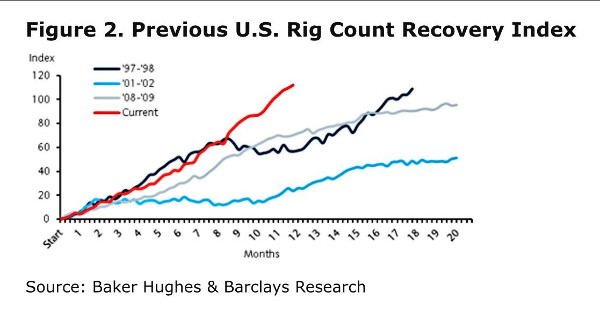
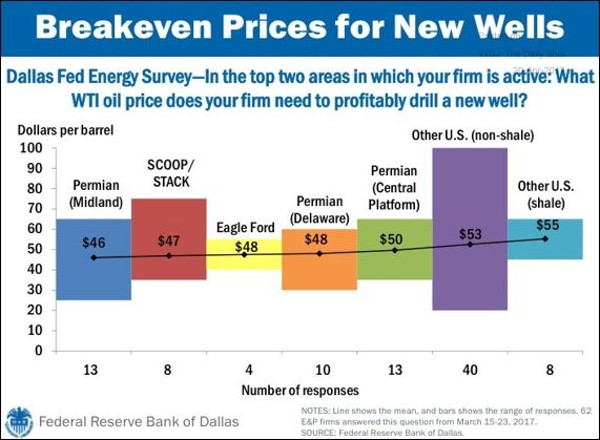
As you can see from the chart, shale producers have become more efficient. They have lowered their breakeven costs from the mid-$40s to the mid-$50s on average. The price of oil would need to fall to the low $40s for production cuts to start.
The problem for OPEC nations is that while they can have large profit margins with oil at that price, their governments rely on oil being much higher to avoid large deficits. OPEC will not be able to maintain cuts indefinitely to insure oil prices stay in the low $40s to slow American shale production.
Furthermore, if oil fell to the low $40s, American producers would probably be able to manage by cutting costs further. The only way US shale will feel pain is if junk bond yields increase.